One of the most common misconceptions is that inflation risk is rising due to the growth in money supply. This misunderstanding is largely driven by the headlines of the Federal Reserve buying $85 billion of securities each month, in addition to other central banks' actions.
In normal times this level of aggressive purchases would indeed spur the money supply, but we are not in normal times. Let's review a few things:
September 2012
Federal Reserve announces it will purchase $40 billion of US Treasuries per month. At the time, growth in M2 was falling quickly, from close to 10% in June to under 6% in September. Excess reserves were falling almost 10% annually. The slowing of the velocity of M2 was beginning to moderate, declining less than 3% annually after falling around 5% during the previous twelve months.
December 2012
Federal Reserve announce it will purchase $45 billion of mortgage backed securities per month, in addition to the purchases of treasuries. M2 growth had bounced upward in October and November was appeared headed back down. Excess reserves were still declining but lower single digits annually. The velocity of money continues to decline, but at a more consistent low single digit average.
Present Day
Excess reserves are growing over 10% annually.
Thursday, May 2, 2013

Wednesday, April 17, 2013
Curtains for Monetary Policy?
In this article I argue that we may be reaching an end game for monetary policy. As economies continue to sputter and the central banks continue to pursue extraordinary measures, the question should be raised: What are we accomplishing? And, at what long-term cost?
There is little doubt the Federal Reserve's quantitative easing policy has helped bolster asset prices, especially prices for bonds, equity and houses. The U.S. stock markets sit around record highs, treasury yields are near record lows, and interest rates on mortgages are near record lows. These factors have created a "wealth effect" in which owners of these assets feel better off.
The question is: Does this asset appreciation mean we reach an "escape velocity" for the economy or does it set us up for greater volatility (ie. another burst bubble)?
Time will prove the fairest judge of this debate. But for now, maybe the biggest long lasting impact of recent monetary policy has been in the area of academia. Through Mr. Bernanke's tinkering we are learning about the limitations of monetary policy. It is becoming apparent that monetary policy has a direct impact on asset prices but the impact on labor markets and consumer spending is more indirect, and potentially dominated by other factors. Similar to a whip, Bernanke applies force to one end with the expectation of a "crack" at the other end. Will the monetary force used to lift asset prices result in a Bernanke-Jones whip-like economic snap or a Bernanke-Tube Man violation?
The declining velocity of money and slowing growth in the money supply suggest more of a tube man blowing hot hair than Indiana Jones getting the treasure (and girl). Slowing velocity and slowing monetary base growth equals slowing nominal GDP. In other words, inflation risk is declining and deflation risk is increasing, supported by weak gold prices and TIPS.

Recent economic releases continue to paint a mixed economic picture. Consumer spending appears weakening, with cash-register sales declining 0.4% in March. Consumer sentiment fell to the lowest level in nine months. Retailers are actually cutting jobs. The reasons for this weakness are varied, including rising healthcare costs consuming more of a family's budget, rising income taxes, falling mortgage refinancing activity as rates have been at a prolonged nadir, and federal sequestration.
The recent weakness in bank earnings, and the nearing end of lowering loan-loss reserves to bolster earnings, may provide a clearer picture of the strength of the economy. In an ultra low long-term rate environment it is challenging for financial companies to produce acceptable returns. Even more concerning, a research article by Robert C. Merton highlights that due to explicit and implicit government guarantees bank earnings face a "doubly convex" curve, masking the real risk to banks' earnings when the economy worsens and increasing economic volatility. So what seems like satisfactory risk controls in a normal environment can quickly deteriorate into a crisis during an economic downturn.
Central banks are raising the stakes in their battle to drive economic growth, a notion that should cause more skepticism. Most recently, Japan's central bank has committed to expand its balance sheet through asset purchases at the rate of 1% of GDP each month, potentially doubling the base money within two years. This policy is expected to continue for as long as necessary. All of this to offset a naturally deflationary environment caused by an aging population and a relatively inflexible economy. Are central banks lifting us to a recovery or simply holding on as more weight is added to a recession scenario?
Rising prices are not a major contributor with most commodity prices flat to down, including major influences like gasoline and food. Countries that have traditionally relied on commodity exports have been experiencing weakness, including Canada and Chile. In fact, with a consumer debt level to disposable income at a record level of 165% and oil revenue $6 billion below expectations, there is growing concern in Canada that the economy will continue to weaken.
In an environment in which some have characterized as a "no bad news" environment for markets, there is a deep fundamental belief that the monetary policy can cure all. In a perverse way, bad labor market statistics actually encourage the markets because the likelihood of the Fed extending its easing stance increases. Great for the asset markets but maybe not as much so for the economy, especially when growing risks of price destabilization, either inflationary or deflationary, are considered
The markets continue to skip down the path paved by the Bernanke-the-wizard's dollars. Take away that dollar-covered curtain and the picture is down right scary.
There is little doubt the Federal Reserve's quantitative easing policy has helped bolster asset prices, especially prices for bonds, equity and houses. The U.S. stock markets sit around record highs, treasury yields are near record lows, and interest rates on mortgages are near record lows. These factors have created a "wealth effect" in which owners of these assets feel better off.
The question is: Does this asset appreciation mean we reach an "escape velocity" for the economy or does it set us up for greater volatility (ie. another burst bubble)?
Time will prove the fairest judge of this debate. But for now, maybe the biggest long lasting impact of recent monetary policy has been in the area of academia. Through Mr. Bernanke's tinkering we are learning about the limitations of monetary policy. It is becoming apparent that monetary policy has a direct impact on asset prices but the impact on labor markets and consumer spending is more indirect, and potentially dominated by other factors. Similar to a whip, Bernanke applies force to one end with the expectation of a "crack" at the other end. Will the monetary force used to lift asset prices result in a Bernanke-Jones whip-like economic snap or a Bernanke-Tube Man violation?
The declining velocity of money and slowing growth in the money supply suggest more of a tube man blowing hot hair than Indiana Jones getting the treasure (and girl). Slowing velocity and slowing monetary base growth equals slowing nominal GDP. In other words, inflation risk is declining and deflation risk is increasing, supported by weak gold prices and TIPS.

Recent economic releases continue to paint a mixed economic picture. Consumer spending appears weakening, with cash-register sales declining 0.4% in March. Consumer sentiment fell to the lowest level in nine months. Retailers are actually cutting jobs. The reasons for this weakness are varied, including rising healthcare costs consuming more of a family's budget, rising income taxes, falling mortgage refinancing activity as rates have been at a prolonged nadir, and federal sequestration.
The recent weakness in bank earnings, and the nearing end of lowering loan-loss reserves to bolster earnings, may provide a clearer picture of the strength of the economy. In an ultra low long-term rate environment it is challenging for financial companies to produce acceptable returns. Even more concerning, a research article by Robert C. Merton highlights that due to explicit and implicit government guarantees bank earnings face a "doubly convex" curve, masking the real risk to banks' earnings when the economy worsens and increasing economic volatility. So what seems like satisfactory risk controls in a normal environment can quickly deteriorate into a crisis during an economic downturn.
Central banks are raising the stakes in their battle to drive economic growth, a notion that should cause more skepticism. Most recently, Japan's central bank has committed to expand its balance sheet through asset purchases at the rate of 1% of GDP each month, potentially doubling the base money within two years. This policy is expected to continue for as long as necessary. All of this to offset a naturally deflationary environment caused by an aging population and a relatively inflexible economy. Are central banks lifting us to a recovery or simply holding on as more weight is added to a recession scenario?
Rising prices are not a major contributor with most commodity prices flat to down, including major influences like gasoline and food. Countries that have traditionally relied on commodity exports have been experiencing weakness, including Canada and Chile. In fact, with a consumer debt level to disposable income at a record level of 165% and oil revenue $6 billion below expectations, there is growing concern in Canada that the economy will continue to weaken.
In an environment in which some have characterized as a "no bad news" environment for markets, there is a deep fundamental belief that the monetary policy can cure all. In a perverse way, bad labor market statistics actually encourage the markets because the likelihood of the Fed extending its easing stance increases. Great for the asset markets but maybe not as much so for the economy, especially when growing risks of price destabilization, either inflationary or deflationary, are considered
The markets continue to skip down the path paved by the Bernanke-the-wizard's dollars. Take away that dollar-covered curtain and the picture is down right scary.
Monday, February 4, 2013
Economic Growth of 4% in 2013?
A few predictions for 2013
How can I be so sure in my "prediction?" Because I believe that price stability is the largest threat to the economy, and therefore 2013 nominal GDP has such a wide potential range that predicting its growth is no better than a game of darts. Following on from my last article, the Federal Reserve has done a masterful job so far at balancing the fundamental deflationary forces in the economy with the inflationary forces of the QE strategy. But, their path is narrowing and their control loosening, in my opinion.
Fundamental deflationary forces are coming from trends like:
Hold onto your hats because I believe the markets have been lulled into a feeling of "the Fed has our backs," allowing that silent killer called risk to creep further into our economy, likely producing large price swings in my view. Let us just hope that Mr. Bernanke is as cunning and well-equipped as the Roadrunner when the silent killer of risk sneaks up on investors.
- Global economic growth of 3.5%, accelerating from 3.2% in 2012 (Source: IMF)
- US economic growth of 2.0%, accelerating to 3.0% in 2014 (Source: IMF)
- US Retail sales growth of 3.4%, with on-line sales growth between 9% to 12% (Source: NFR)
How can I be so sure in my "prediction?" Because I believe that price stability is the largest threat to the economy, and therefore 2013 nominal GDP has such a wide potential range that predicting its growth is no better than a game of darts. Following on from my last article, the Federal Reserve has done a masterful job so far at balancing the fundamental deflationary forces in the economy with the inflationary forces of the QE strategy. But, their path is narrowing and their control loosening, in my opinion.
Fundamental deflationary forces are coming from trends like:
- Technology advancement
- Excess capital in industries like retail
- Mis-allocated capital as banks postpone write-offs of under-performing loans
- A leveraged consumer based on debt to income
- Flat real income
- Rising taxes paid on income, reducing disposable income
- More controlled government spending, especially in Europe and wind-down of wars
- Raising income after interest expense through lower interest rates
- Encouraging capital investment by lowering the cost of capital
- Inflating both financial and tangible asset prices through direct purchases and lower financing
Hold onto your hats because I believe the markets have been lulled into a feeling of "the Fed has our backs," allowing that silent killer called risk to creep further into our economy, likely producing large price swings in my view. Let us just hope that Mr. Bernanke is as cunning and well-equipped as the Roadrunner when the silent killer of risk sneaks up on investors.
Wednesday, January 23, 2013
Federal Reserve On Road to Vanishing Point?
Vanishing Point - In art, the point on the horizon line at which
any two or more parallel lines seem to meet.
For this article, the space between the two lines represents the road of Quantitative Easing with price stability, the space to the left - deflation, and the space to the right - inflation. The longer the Federal reserve extends QE into the future, the harder it becomes to maintain price stability, ultimately proving unsustainable at the vanishing point. Our position remains fixed as we watch the Fed drive down the road.

Deflationary - Commodities, Wage-Price
Neutral - Currency, Fiat, Good and Services
Inflationary - Financial Assets, Tangible Assets
In this entry I again borrow the framework developed by A. Gary Schilling on inflation to breakdown the trends and hopefully glean a bit more insight into the future. His framework breaks down inflationary/ deflationary pressures into seven areas, which are commodity, wage-price, financial assets, tangible assets, currency, fiat, and goods and services.
Commodity - Deflationary

Wage-Price - Deflationary, but Possibly Recovering
If income growth is flat-to-down, then the only way demand for goods and services can increase is if either debt levels go up (savings go down), or prices go down. Not surprisingly, the radio station WBUR highlighted that breaks in income streams has increasingly contributed to greater financial difficulty amongst consumers.

Indeed, total consumer credit has steadily increased over the past couple years. The main driver of the growth in consumer credit is non-revolving credit, for credit for categories like automobiles, education. As total credit per capita increases, and income remains stagnant, the purchasing power of the consumer declines unless interest rates continue to decline. Alternatively, for a period of time consumption can continue if asset prices are increasing, enabling cash infusions from rising equity in homes and other assets. While debt continues to rise, I believe we are nearing the end game of both falling interest rates and rising home equity.

Financial Assets - Inflationary

Tangible Assets - Inflationary
House prices have been rising, and expectations about the rate of growth have been rising over the six months. This rise in expectations is likely the direct result of the Federal reserve purchasing mortgage-backed securities, pushing mortgage rates lower. Lower rates mean a person can afford to pay more for a house with the same income level. If banks loosen lending standards then the trend in housing prices may accelerate higher as another housing bubble is inflated.

If major banks like Bank of America begin to aggressively go after new lending business then this category may provide a major inflationary force in the economy as banks draw down reserves in order to make loans, increasing the money multiplier and thus the amount of money in circulation.
Currency - Neutral
The US dollar continues to hold up fairly well relative to most other major currencies. This resilience is largely due to the aggressive monetary policies by most foreign central banks, although there is some puzzlement. In addition, the large reserves held by banks has so far reduced the multiplier effect, and thus the actual amount of money in circulation is not nearly as high as the potential. The potential inflationary force of a weaker dollar is likely held in check so long as the US dollar holds its value relative to other major currencies and banks remain conservative with their reserves.

How the debate about the overall role of government plays out likely determines whether this swings inflationary or deflationary. If the gridlock has accomplished anything, it has allowed the status quo to remain in place, neither applying further inflationary pressures through growing deficits nor swinging to deflationary pressures through austerity measures.
Clearly the Republicans prefer the road of austerity through reduced spending, although have accepted limited tax increases to avoid the "fiscal cliff." As we have seen in Europe, this path likely causes an economic slowdown in the near-term with deflationary forces. The Democrats don't want to cut spending and seem a little more accepting of deficit spending in order to spur economic growth, although higher taxes are clearly a part of their argument.
Across the Pacific is Japan, which has pursued endless rounds of stimulus to drive economic growth, only to pile national debt up to 2.5x GDP. Japan has been described as "a fly looking for a windshield," splat is only a matter of time with an aging population and mounting debt. Across the Atlantic is Europe, which has been taking its medicine through more austere measures and seen GDP growth fall. So long as the social and political structures remain in place, Europe should emerge stronger in the long run after a painful retrenchment.
If the "grand bargain" becomes additional higher taxes coupled with lower spending, then this segment swings definitively deflationary. If spending is not cut, and even increased to stimulate the economy, then this segment applies inflationary forces to the economy. More than likely, since the deficit has been trending down, the government agrees on moderate spending cuts. Simply reducing the spending on the war effort should be considered deflationary. Of course, Congress may not increase the debt ceiling and federal spending in indiscriminately and severely cut.
Goods and Services - Neutral
The combination of flat income and rising non-revolving debt balances leaves weaker consumer spending on items typically purchased with credit cards, either discretionary or non-discretionary. It is possible that more aggressive mortgage lending practices by banks may enable home prices to rise, thus providing home owners with larger equity balances with which to spend on goods and services. However, I fear that driver would only lead to another economic shock as US consumers are already tapping 401k balances to pay monthly bills.
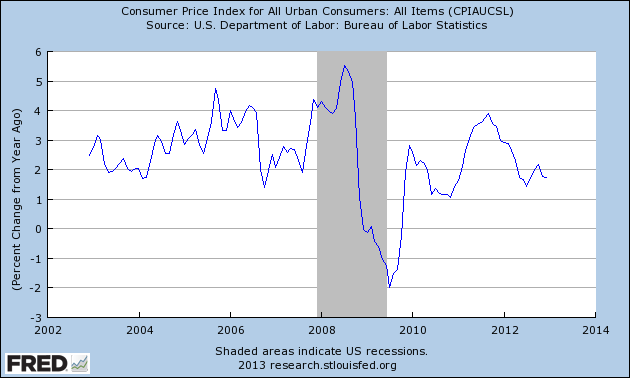
Has the supply of retail declined, thus enabling a rise in prices due to lessening competition? The answer is simply "no." If anything, the American consumer remains over-supplied with stores, as highlighted by the recent weakness in retail REITs focused on strip malls. This over-supply of retail outlets reduces pricing power amongst retailers and provides a deflationary force to the economy. Lower mortgage payments through re-financing and tepid economic growth have so far kept the supply-demand dynamics in balance.
AIER's EPI - Everyday Price Index

Friday, January 11, 2013
America the Producer?
In my last article I highlighted the following:
What I do find interesting is an apparent shift in manufacturing between goods produced domestically versus overseas. Due to a number of economic forces, both macro and micro, there is the beginning of a shift towards domestic manufacturing, in my opinion. Numerous individuals have argued this trend recently, highlighted by Charles Fishman in the December edition of The Atlantic. Indeed, after manufacturing output rose 10% in the first quarter of 2012 the trumpets sounded about America's manufacturing resurrection, only to fall flat for the remainder of the year. So this trend is by no means certain and definitely not smooth. With that said, I plan to explore the argument further.
Macro forces pushing a shift away from overseas to more domestic manufacturing include:
Macro forces paired with fundamental business interests should eventually make for a powerful trend, in my view. Furthermore, the President is also focused on improving the manufacturing capabilities of the country, and thus political interests are aligned with economic trends. Finally, the on-going efforts of the Federal Reserve likely continues to weaken the US dollar over the long-term, adding further support to moving manufacturing back within domestic borders.
So there appears a fairly complete argument driving the growth of domestic manufacturing above GDP growth. The key phrase is "above GDP growth."
The consensus seems to tilt towards healthy GDP growth in 2013, driving favorable earnings growth. The key assumption supporting these views, in my view, is price stability. Given the Federal Reserve's decent track record over the past few years to balancing the deflationary and inflationary forces in the economy (where I have been wrong in my investment thesis), I believe assuming price stability in 2013 is the easy argument. However, changes in fiscal policy and increasing discord within the Federal Reserve may result in more volatile prices going forward. In the next few articles I plan to look into the following topics:
(1) The assumption of price stability
(2) Expected economic growth
(3) Interesting companies likely benefiting from domestic manufacturing
- The Bush-era lower taxes have added a general stimulus to the economy, enabling individuals to purchase more products and services because of a higher after-tax income.
- The larger government outlays as a percentage of GDP have driven growth rates above what is naturally sustainable in segments like defense and construction; and has enabled a woefully inefficient healthcare industry rife with fraud and over-billing.
- The aggressive monetary policies that have fueled falling interest rates have added significant stimulus to the economy, especially in industries requiring debt financing like housing and autos.
What I do find interesting is an apparent shift in manufacturing between goods produced domestically versus overseas. Due to a number of economic forces, both macro and micro, there is the beginning of a shift towards domestic manufacturing, in my opinion. Numerous individuals have argued this trend recently, highlighted by Charles Fishman in the December edition of The Atlantic. Indeed, after manufacturing output rose 10% in the first quarter of 2012 the trumpets sounded about America's manufacturing resurrection, only to fall flat for the remainder of the year. So this trend is by no means certain and definitely not smooth. With that said, I plan to explore the argument further.
Macro forces pushing a shift away from overseas to more domestic manufacturing include:
- Higher oil prices, increasing shipping costs
- Lower natural gas prices in the US, reducing domestic manufacturing costs
- Rising China wages, which have increased five-fold since 2000 in US dollars
- Slack US labor markets and weakened unions in the US, enabling lower domestic labor costs
- Rising US labor productivity, enabling lower domestic labor costs
- Falling dollar relative to China Yuan, making Chinese products more expensive
Macro forces paired with fundamental business interests should eventually make for a powerful trend, in my view. Furthermore, the President is also focused on improving the manufacturing capabilities of the country, and thus political interests are aligned with economic trends. Finally, the on-going efforts of the Federal Reserve likely continues to weaken the US dollar over the long-term, adding further support to moving manufacturing back within domestic borders.
So there appears a fairly complete argument driving the growth of domestic manufacturing above GDP growth. The key phrase is "above GDP growth."
The consensus seems to tilt towards healthy GDP growth in 2013, driving favorable earnings growth. The key assumption supporting these views, in my view, is price stability. Given the Federal Reserve's decent track record over the past few years to balancing the deflationary and inflationary forces in the economy (where I have been wrong in my investment thesis), I believe assuming price stability in 2013 is the easy argument. However, changes in fiscal policy and increasing discord within the Federal Reserve may result in more volatile prices going forward. In the next few articles I plan to look into the following topics:
(1) The assumption of price stability
(2) Expected economic growth
(3) Interesting companies likely benefiting from domestic manufacturing
Tuesday, December 18, 2012
Forget Fiscal Cliff! Can the Economy Grow in Five Years Without Government Stimulus?
I don't know about you, but the hysteria about the fiscal cliff is beginning to really rub me raw. It is not so much the politicians doing their dance. It is instead the distraction from the larger fundamental question of: "What is right for the long-term health of the economy?"
After a big step back, let's consider what deficit spending has meant to the economy.
The amount of taxes paid, as a percentage of GDP, has declined almost 5% of GDP to 15.8%. In other words, instead of paying money to the government, individuals have been purchasing goods and services, a stimulant for the economy. Secondly, government outlays have increased over 6% of GDP to 24.3%. A significant stimulant to the economy has been higher government spending, especially in the area of healthcare.
One can argue that these figures suggest more stimulus is needed in order to avoid an economic slowdown. Indeed, there are economists on the left-side of the spectrum advocating up to $2 trillion of additional stimulus spending in order to grow the "denominator," or GDP. The basis of the argument is that cutting the government deficit produces a 1-to-1 reduction in the private surplus, hurting the economy as witnessed in Europe under austerity measures. Yes, we are talking defined formulas for calculating GDP. Also, intuitively it makes sense that slowing government spending or raising taxes will be a drag on the economy, just as the opposite was true during the last decade.
 Source: New Economic Perspectives
However, this raises the philosophical question of whether the government should be the main driver of economic growth for an extended period of time. The government can obviously drive growth, but when pursued for a decade how does this type of growth driver pervert private economic activity? President Obama has maintained budget deficits in excess of 7% of GDP during his term in office. While this has helped avoid a more catastrophic depression, I fear it is also increasing systemic risk as companies increasingly rely on both government spending and lower income and capital gains taxes, either directly or indirectly.
Where I respectively disagree is sustainability of these policies. Economists advocating stimulus spending generally argue that by growing GDP through deficits, the economy can reach a self-perpetuating growth rate, at which point the government can remove stimulus spending and on-going growth can then pay down the debt. Based on this theory, you would think after 4 years of historically high deficits the economy would have performed better. In fact, the only period in the last 10 years of fiscal stimulus that has approached "normal" economic activity was the result of an inflating housing bubble that proved short lived. I suppose an ever increasing deficit and increasingly aggressive monetary policy can keep the economy growing, but there may be a diminishing impact on GDP growth as inefficiencies in the economy are allowed to remain.
The budget deficit as a percentage of GDP has been 10.1%, 9.0%, 8.7% and 7.0% for 2009 through 2012, respectively. To put this in perspective, the largest budget deficits since WWII were a little over 5%, which only happened twice. In 2013, the budget deficit is forecast between 5.5% to 6.0%.
Again, let's review some numbers:
Why does the US benefit from ultra-low interest rates while other countries with a slightly higher debt-to-GDP have interest rates spike upwards? One of the main reason, in my opinion, is because of the Fed's bond buying. However, the size and strength of the US economy, a focus mostly on public debt, falling debt service payments, and the view of the dollar as a safe currency play important roles. But, the disparity in interest rates has caused some head-scratching. I believe my Sagflation theory helps to explain this issue through the combination of fundamental deflationary forces offset by expansionary monetary policies, both of which are pushing interest rates lower.
So debt levels have been rising. At what level does the bond market pull back from US debt is very much debatable. I will leave it by stating the obvious, the higher the leverage ratio the less forgiving is the bond market if the economy slows. Stimulative policies that raise the leverage ratio increase the risk of interest rates spiking should the economy slow before the debt can be reduced.
Why I Continue to Remain Bearish
Returning to two points made previously, and adding one more. Since 2000, the following has happened in the economy:
The larger government outlays as a percentage of GDP have driven growth rates above what is naturally sustainable in segments like defense and construction; and has enabled a woefully inefficient healthcare industry rife with fraud and over-billing. The growth rates in these industries likely moderate, although healthcare may prove more resilient given the changes to the healthcare laws.
The falling interest rates have added significant stimulus to the economy, especially in industries requiring debt financing like housing and autos. Not surprisingly, both the housing market and auto industry has enjoyed a lift as the Fed aggressively purchases treasuries and mortgage-backed securities.
The critical question, in my mind, and the one everyone is fighting over is this:
Is the economy structurally efficient for the long-term?
Hard to answer this question, but I think the fundamental deflationary forces, shadowed by excessive bank reserves, hint at over-supply and poor returns in many industries. Structurally the tax code is inefficient and this constant whining from business leaders about "uncertainty" in Washington hints of businesses too closely tied to the government and its policies. Finally, the rising amount of poorly written regulation as the government reacts to crises is likely having a cooling effect on the economy.
Mr. Bernanke can keep the growth engine bouncing along as the Fed's balance sheet now exceeds $3 trillion, and in many ways he is doing what is necessary to avoid a deflationary death spiral. But, until the government enables the economy to become more efficient I believe we are doomed to Stagflation.
So while the federal government pursues stimulative measures the markets likely respond favorably. These policies could continue throughout President Obama's term in office. However, the exit of these policies becomes riskier as the debt balance rises and the Federal Reserve's balance sheet inflates. For a fundamental analyst, it is tough to swallow any company-specific analysis when the foundation of the economy seems softer and riskier than ever before.
After a big step back, let's consider what deficit spending has meant to the economy.
| % of GDP | 2000 | 2012 |
| Total Government Receipts | 20.6% | 15.8% |
| Total Government Outlays | 18.2% | 24.3% |
The amount of taxes paid, as a percentage of GDP, has declined almost 5% of GDP to 15.8%. In other words, instead of paying money to the government, individuals have been purchasing goods and services, a stimulant for the economy. Secondly, government outlays have increased over 6% of GDP to 24.3%. A significant stimulant to the economy has been higher government spending, especially in the area of healthcare.
One can argue that these figures suggest more stimulus is needed in order to avoid an economic slowdown. Indeed, there are economists on the left-side of the spectrum advocating up to $2 trillion of additional stimulus spending in order to grow the "denominator," or GDP. The basis of the argument is that cutting the government deficit produces a 1-to-1 reduction in the private surplus, hurting the economy as witnessed in Europe under austerity measures. Yes, we are talking defined formulas for calculating GDP. Also, intuitively it makes sense that slowing government spending or raising taxes will be a drag on the economy, just as the opposite was true during the last decade.

However, this raises the philosophical question of whether the government should be the main driver of economic growth for an extended period of time. The government can obviously drive growth, but when pursued for a decade how does this type of growth driver pervert private economic activity? President Obama has maintained budget deficits in excess of 7% of GDP during his term in office. While this has helped avoid a more catastrophic depression, I fear it is also increasing systemic risk as companies increasingly rely on both government spending and lower income and capital gains taxes, either directly or indirectly.
Where I respectively disagree is sustainability of these policies. Economists advocating stimulus spending generally argue that by growing GDP through deficits, the economy can reach a self-perpetuating growth rate, at which point the government can remove stimulus spending and on-going growth can then pay down the debt. Based on this theory, you would think after 4 years of historically high deficits the economy would have performed better. In fact, the only period in the last 10 years of fiscal stimulus that has approached "normal" economic activity was the result of an inflating housing bubble that proved short lived. I suppose an ever increasing deficit and increasingly aggressive monetary policy can keep the economy growing, but there may be a diminishing impact on GDP growth as inefficiencies in the economy are allowed to remain.
The budget deficit as a percentage of GDP has been 10.1%, 9.0%, 8.7% and 7.0% for 2009 through 2012, respectively. To put this in perspective, the largest budget deficits since WWII were a little over 5%, which only happened twice. In 2013, the budget deficit is forecast between 5.5% to 6.0%.
Again, let's review some numbers:
- US Debt Held by Public - $11.5 trillion (~ 75% of GDP)
- US Debt Outstanding - $16.3 trillion (Greater than 100% of GDP)
- Estimated US Debt Outstanding 2016 - $22.8 trillion (~ 150% of GDP)
- Total Liabilities of US Government (Soc Sec, Medicare, Govt pensions) - $86.8 trillion (550% of GDP)
Why does the US benefit from ultra-low interest rates while other countries with a slightly higher debt-to-GDP have interest rates spike upwards? One of the main reason, in my opinion, is because of the Fed's bond buying. However, the size and strength of the US economy, a focus mostly on public debt, falling debt service payments, and the view of the dollar as a safe currency play important roles. But, the disparity in interest rates has caused some head-scratching. I believe my Sagflation theory helps to explain this issue through the combination of fundamental deflationary forces offset by expansionary monetary policies, both of which are pushing interest rates lower.
So debt levels have been rising. At what level does the bond market pull back from US debt is very much debatable. I will leave it by stating the obvious, the higher the leverage ratio the less forgiving is the bond market if the economy slows. Stimulative policies that raise the leverage ratio increase the risk of interest rates spiking should the economy slow before the debt can be reduced.
Why I Continue to Remain Bearish
Returning to two points made previously, and adding one more. Since 2000, the following has happened in the economy:
- Taxes paid, as a percentage of GDP, has declined almost 5% of GDP to 15.8%.
- Government outlays have increased over 6% of GDP to 24.3%.
- Interest rates on 10-Year Treasuries from around 6% to about 1.5%.
The larger government outlays as a percentage of GDP have driven growth rates above what is naturally sustainable in segments like defense and construction; and has enabled a woefully inefficient healthcare industry rife with fraud and over-billing. The growth rates in these industries likely moderate, although healthcare may prove more resilient given the changes to the healthcare laws.
The falling interest rates have added significant stimulus to the economy, especially in industries requiring debt financing like housing and autos. Not surprisingly, both the housing market and auto industry has enjoyed a lift as the Fed aggressively purchases treasuries and mortgage-backed securities.
The critical question, in my mind, and the one everyone is fighting over is this:
Is the economy structurally efficient for the long-term?
Hard to answer this question, but I think the fundamental deflationary forces, shadowed by excessive bank reserves, hint at over-supply and poor returns in many industries. Structurally the tax code is inefficient and this constant whining from business leaders about "uncertainty" in Washington hints of businesses too closely tied to the government and its policies. Finally, the rising amount of poorly written regulation as the government reacts to crises is likely having a cooling effect on the economy.
Mr. Bernanke can keep the growth engine bouncing along as the Fed's balance sheet now exceeds $3 trillion, and in many ways he is doing what is necessary to avoid a deflationary death spiral. But, until the government enables the economy to become more efficient I believe we are doomed to Stagflation.
So while the federal government pursues stimulative measures the markets likely respond favorably. These policies could continue throughout President Obama's term in office. However, the exit of these policies becomes riskier as the debt balance rises and the Federal Reserve's balance sheet inflates. For a fundamental analyst, it is tough to swallow any company-specific analysis when the foundation of the economy seems softer and riskier than ever before.
Wednesday, November 14, 2012
The Nose in the Book Penalty
Last year, in the run-up to the debt ceiling, I wrote how the Democrats were advocating a pro-inflation policy of stimulus while Republicans were advocating a pro-deflation policy of austerity. The outcome was ultimately a stalemate that led to the status quo, enabling on-going stimulus deficit spending combined with monetary easing.
Roll the clock forward almost 18 months and the national debt has continued to climb, the economy enjoyed a short-term spurt, and the economic outlook is darkening. So much for the stimulus of another $1 trillion deficit in 2012. The Democrats now appear to be second-guessing the stimulus argument, instead encouraging more of a focus on reducing the deficit. At least the two sides are now focusing on the single largest controllable factor.
Now the argument has shifted from deficit spending versus austerity to what type of austerity: higher tax collections or lower spending. While good because DC is slowly spiraling in on confronting the core problem, it is scary because austerity means likely pain. Put differently, the debate is now over who feels the most chilled by austerity.
Not surprisingly, the argument has quickly devolved into a type of class warfare. The Republicans clearly defending the rich through lower taxes and the Democrats clearly defending the poor through protection of entitlements. In the cross hairs is the middle class, who could feel the pain of both higher taxes and reduced entitlements. Thus the debate over which plan protects the middle class.
From here there are three defined paths, the Democrat path of higher tax rates with minimal entitlement cuts, the Republican path of significant cuts to entitlement spending and minimal tax increases, and the "kick the can down the road" solution our leaders love so much. Given that the President believes he received a voter mandate for higher taxes and the House Republicans believe they have a mandate to cut entitlements, the chances of compromise seem dim. The only real obstacle to the final path is the fiscal cliff, which seems to look more and more enticing to politicians as they struggle (or simply refuse) to compromise.
Ultimately I believe we need to "pay the piper," most likely through higher taxes AND meaningful entitlement cuts. Compromise must happen. But, since our politicians seem incapable of serious and intelligent compromises over a path out of our mess, we are likely to choose the least thoughtful and most disruptive path of the fiscal cliff. Yet should we go over the cliff we likely continue to have a deficit of over half a trillion dollars (assuming interest rates remain low) due to the sheer size of the problem. Maybe after going over the cliff our voter-elected partisan leaders will get down to actually figuring out some compromises.
If only there was a "nose in the book penalty" for our politicians who refuse to compromise...
Roll the clock forward almost 18 months and the national debt has continued to climb, the economy enjoyed a short-term spurt, and the economic outlook is darkening. So much for the stimulus of another $1 trillion deficit in 2012. The Democrats now appear to be second-guessing the stimulus argument, instead encouraging more of a focus on reducing the deficit. At least the two sides are now focusing on the single largest controllable factor.
Now the argument has shifted from deficit spending versus austerity to what type of austerity: higher tax collections or lower spending. While good because DC is slowly spiraling in on confronting the core problem, it is scary because austerity means likely pain. Put differently, the debate is now over who feels the most chilled by austerity.
Not surprisingly, the argument has quickly devolved into a type of class warfare. The Republicans clearly defending the rich through lower taxes and the Democrats clearly defending the poor through protection of entitlements. In the cross hairs is the middle class, who could feel the pain of both higher taxes and reduced entitlements. Thus the debate over which plan protects the middle class.
From here there are three defined paths, the Democrat path of higher tax rates with minimal entitlement cuts, the Republican path of significant cuts to entitlement spending and minimal tax increases, and the "kick the can down the road" solution our leaders love so much. Given that the President believes he received a voter mandate for higher taxes and the House Republicans believe they have a mandate to cut entitlements, the chances of compromise seem dim. The only real obstacle to the final path is the fiscal cliff, which seems to look more and more enticing to politicians as they struggle (or simply refuse) to compromise.
Ultimately I believe we need to "pay the piper," most likely through higher taxes AND meaningful entitlement cuts. Compromise must happen. But, since our politicians seem incapable of serious and intelligent compromises over a path out of our mess, we are likely to choose the least thoughtful and most disruptive path of the fiscal cliff. Yet should we go over the cliff we likely continue to have a deficit of over half a trillion dollars (assuming interest rates remain low) due to the sheer size of the problem. Maybe after going over the cliff our voter-elected partisan leaders will get down to actually figuring out some compromises.
If only there was a "nose in the book penalty" for our politicians who refuse to compromise...
Wednesday, November 7, 2012
We are a country of "AND's" voting for "OR's."
In a Coke Zero advertisement we watch a man emphatically dismiss "OR" and choose "AND..." to complete all his desires. The marketing behind this is pure genius, tapping into our sense of unfulfilled entitlement through a can of soda. The government has been governing in much the same manner, dismissing the need to choose and fulfilling our expectations of happiness through deficit spending AND... (wait for it...) money printing.
Everyone has been waiting for the election to solve our problems. We finally have a resolution! Obama remains President, the House remains Republican, and the Senate remains Democrat without a filibuster-proof majority. YEAH! ...Wait a second...o crap.
I love listening to the pundits spin it the morning after the election. The Democrats spin it as the Republicans now have to work with the President and the Republicans spin it as a messaging problem rather than a policy problem. Great, not much "hope" for the next four years.
But really, why should we expect our politicians to choose compromise when the voters choose partisan politicians? Moderates are a dying breed in the Senate, which is really a shame since Senators are the people who can usually broker some type of solution. (It is much more difficult to foster compromise in the House for multiple structural reasons.) If there was a message sent by the voters, it was party first, country second. We are a country of "AND's" voting for "OR's."
So do we go over the "fiscal cliff?" Looks pretty likely, in my view. Even after the lame duck session, the House likely remains opposed to tax increases. The fiscal cliff is simply a convenient maneuver to raise taxes without actually voting for it in the new session, while cutting some spending. The Senate can be filibustered from here to the next election. Maybe the President tries again to work with the House, but he will likely strike a harder line because of his re-election and his failure at brokering a debt ceiling deal last year.
Will Bernanke return the favor to the President now that his job seems more assured? Quite possibly, but at what expense? Good chance the US dollar slips more as money printing continues, pushing the country further along my Sagflation theme of fundamental deflationary forces offset by inflationary monetary policies. Sure, we can balance on the wire between these two forces for some time, but I fear the canyon is getting deeper and the winds stronger. We may see a very sudden spike in price volatility if the QE strategy begins to shake.
I remain largely in cash with a sizable position short the market. No need to change now since not much changed in the world yesterday, in my view.
Monday, September 24, 2012
Bubble Economics
we live in a bubble baby.
a bubble's not reality.
you gotta have a look outside.
nothing in a bubble, is the way it's supposed to be,
and when it blows you'll hit the ground.
a bubble's not reality.
you gotta have a look outside.
nothing in a bubble, is the way it's supposed to be,
and when it blows you'll hit the ground.
"Living In A Bubble" - EIFFEL 65
Sometimes pop culture captures the essence of the business environment. In this article I argue that we are living in an all-encompassing bubble created by the combination of a fundamentally deflationary U.S. economy and a decade of Federal Reserve overly aggressive policies focused on asset prices, instead of growth and inflation.
In the last article I highlighted data from McKinsey and Company that illustrated how ROIC bubbled up out of its historical range during 2004-2008. I ended the article with a series of possible reasons for this phenomenon, including tax rates, offshore labor, and monetary policy. In this article I put forth my theory that builds on my Sagflation thesis.
Sagflation Thesis
The Sagflation thesis argues that we are in a period of slow to negative real economic activity combined with more volatile prices caused by aggressive monetary policies. Capital allocation decisions have been perverted by interest rate manipulation for an extended period of time, resulting in the misallocation of capital in the economy. This manipulation has allowed economic activity to remain elevated and offset fundamental healthy deflationary forces in the economy, including offshore labor utilization, technology advancements, and lower tax rates. However, the artificially elevated economic activity has enabled poor capital allocation, increasing bad deflationary forces in the economy as low return projects founder. For a strong explanation of why investment spending is what really matters, please read Andy Kessler's editorial in the WSJ.
By repeatedly stimulating the economy through monetary policies, the bad capital decisions remain viable and likely even encourage additional poor capital allocation decisions. All this results in more volatile prices as fundamental deflationary forces are countered by increasingly inflationary monetary policies, something at which the Federal Reserve has become quite good.
Bubble Economics
By the end of 2013 the Federal Reserve could hold well over $3 trillion of government and mortgage-backed debt securities, assuming the government maintains its balance of treasury debt and continues to purchase about $40 billion of mortgage bonds each month. The Bank of England holds around $600 billion of government debt. The European Central Bank has announced a commitment to unlimited buying of bonds of troubled nations. The Bank of Japan recently expanded its asset-purchase program to over $1 trillion. Various other countries have implemented programs to manage interest and currency exchange rates.
The central banks are focused on driving GDP growth by expanding the money supply. However, actual nominal GDP growth remains weak. In formulaic economic terms, the velocity of the U.S. money supply continues to fall and the level of U.S. excess reserves continues to climb, largely offsetting the the efforts of the Federal Reserve and leaving nominal GDP below the desired level. These two variables suggest two possible trends: (1) individuals and businesses are holding money longer, which contributes to the decline in velocity, and (2) the demand for new loans is not strong enough to absorb the additional reserves supplied to the banks, which impacts velocity and excess reserves. As Professor John Harvey explains, "Supplying money is like supplying haircuts: you can’t do it unless a corresponding demand exists." Although I will add that changes in the credit approval standards of the banks, which may be loosening, has a significant impact on demand.
Both these trends suggest fundamental deflationary forces are present in the U.S. economy as income levels fall and consumers and businesses reduce leverage. As deflation expectations increase (such as for house values or wages) individuals are likely to hold their money more in cash for a longer period of time (driving actual deflation), just as the opposite is possible for inflation and hyperinflation. In essence, this may be one of the key reason for the Federal Reserve targeting mortgage-backed securities for the latest round of QE, to elevate house prices and attempt to change expectations towards inflation.


So if not economic growth, what has the monetary policy impacted? Benn Steil and Dinah Walker argue in the WSJ that the Federal Reserve changed its policy around 2000, from focusing on economic growth and inflation to a focus on asset prices. "Between 2000 and 2008...the Fed was behaving as if it were targeting "risk on, risk off," moving interest rates to push investors toward or away from risky assets." They argue that since 2009 the Federal Reserve has intended to mimic a negative interest rate environment.
Another way to consider this argument is that a deflationary environment should produce extremely low and even negative interest rates. From this perspective, the Federal Reserve recognizes, either on a conscious or unconscious level, the reality of the fundamentals and has created a mechanism to enable markets to function in their historical form with positive interest rates.
In either case, the question becomes: Is the monetary policy matched to the fundamental economic growth and inflation trends of the economy? Given my argument that we are in a deflationary environment, which implies negative economic growth, and the Federal Reserve targets a more historically normal growth rate, I believe the simple answer to be: no.
Thus, the follow-on question becomes: What long-term outcomes should we expect from this policy? In my opinion, under my Sagflation thesis the long-term outcome includes an increasingly narrow for the Federal Reserve to maintain price stability, eventually resulting in either accelerating inflation or deflation.
Economic Fundamentals
Returning to the bubbling up of ROIC between 2004 and 2008. The best possible answer for this deviation from the historical range would be that businesses found extraordinary investment opportunities through R&D processes that opened massive untapped markets. This didn't happen. Instead, I believe this extraordinary period is largely explained by global economic trends and more rigid structural issues in the U.S. economy, exasperated by government actions. On the cost side, businesses enjoyed falling cost pressures as labor costs subsided through offshore arbitrage of costs, operational costs declined as technology advancements enabled more efficient processes, and tax code changes that both boosted spending and enabled lower corporate tax payments.
On the revenue side, businesses benefited from a falling interest rate environment, which spurred demand as consumers enjoyed lower debt service expenses. Amplifying this trend was the levering-up by the consumer. Additionally, businesses have developed more effective marketing strategies through improved customer data collection and targeting enabled by the internet. Specific businesses may also have benefited from rising barriers to entry through favorable patent decisions. All of these trends were the likely core drivers of an expanding ROIC for a short period of time.
From a financing perspective, the historically low interest rate environment encouraged business expansion as financing terms became more favorable, pushing up the velocity of money. Factor in a relatively lenient credit approval process and the result was likely growth above a sustainable level, as evidenced by the housing bubble. Since 2007 the credit approval process has been tighter, reducing the ability of the central banks to expand the money supply. This trend may be shifting, so long as banks remain confident that economic growth remains positive.
Eventually excessive economic profits tend to diminish due to competitive pressures, investment in lower return projects, and reversal of shorter term favorable trends. I believe we are witnessing reversal of a few key trends that were favorable. Arbitraging labor costs with less expensive foreign labor is becoming less feasible due to higher transportation costs, rising wages overseas, and hidden costs associated with operational complexity, skills management, and intellectual property. While technology continues to advance, the technology companies focused on consumer products have enjoyed the strongest growth, possibly implying businesses are experiencing diminishing returns on technology investments. However, a lasting impact has been the median income falling four straight years to 1995 levels, simply affirming the deflationary forces present in the economy.
A couple trends could continue to work against businesses, or possibly turn positive. Since the financial meltdown in 2007/2008 credit approval processes have been tightened, pushing consumer debt levels lower and hindering consumer spending. Whether credit approval remains tight or begins to loosen again is an open question. Finally, the tax code remains riddled with special interest loop holes that benefit certain businesses but make the overall expense of tax preparation more expensive. Next year may see the tax code cleaned up for businesses, albeit producing both winners and losers.
Of course the economy also has the issue of the fiscal cliff, in which taxes increase and spending decreases. If Congress does not act on this issue then a significant deflationary force may be introduced next year.
Internationally, Europe continues to battle the economic slowdown that is applying deflationary pressures in the economy. If the European Central Bank can navigate a tricky path to further stimulation then these force may be offset. Asia's labor markets appear fairly tight and combined with expansionary monetary policies may cause accelerating inflation. That said, an aging population in Japan and high inventory levels in China apply deflationary forces.
In short, price stability appears to be waning.
Investment Implications
So where does this leave an investor? If deflationary forces take hold then treasuries and cash are attractive investments. If inflationary forces accelerate then precious metals and other commodities. If the prices remain in the relative sweet spot of 1-3% annual increases then equities likely remain attractive. However, I believe we may see price changes swing through the sweet spot between inflationary and deflationary more violently as fundamentals continue to wrestle with monetary policies.
For now I remain mostly in cash.
Wednesday, September 12, 2012
Was 2004-2010 The Best Business Environment EVER?
Main Point: During the period of 2003 to probably about 2010 businesses produced historically high returns while benefiting from historically low capital costs, resulting in significant excessive profit. Why does this mean going forward for the economy, markets and government policy?
 Source: Koller, Tim; Goedhart, Marc; Wessels, David; McKinsey & Company Inc.
(2010-07-16). Valuation: Measuring and Managing the Value of Companies
(Wiley Finance) (Kindle Location 1707). John Wiley and Sons. Kindle
Edition.
Source: Koller, Tim; Goedhart, Marc; Wessels, David; McKinsey & Company Inc.
(2010-07-16). Valuation: Measuring and Managing the Value of Companies
(Wiley Finance) (Kindle Location 1707). John Wiley and Sons. Kindle
Edition.
Every 5-10 years I like to re-read an updated version of my favorite book on valuation, Valuation: Measuring and Managing the Value of Companies by Tim Koller. I first read it in 1995, skimmed through it again around 2002, and have been reading the latest version. It always reminds of this important point:

Every 5-10 years I like to re-read an updated version of my favorite book on valuation, Valuation: Measuring and Managing the Value of Companies by Tim Koller. I first read it in 1995, skimmed through it again around 2002, and have been reading the latest version. It always reminds of this important point:
"The guiding principle of value creation is that companies create value by investing capital they raise from investors to generate future cash flows at rates of return exceeding the cost of capital."
With this in mind, I have been considering the effect on business during a period of falling cost of capital. In 2009, Tim Koller estimated the cost
of equity capital for most large companies fell in the range of 8-10%
when the yield on the ten-year treasury was around 3% and they used a
risk premium of 5.4%. In the second edition of the book, published in
1994 using examples from the early 1990's when the 10-year treasury
yield was around 7%, the authors used a market risk premium of about
5-6%, which likely implied a cost of equity capital for most large
companies between 12-14%. From the debt perspective, the interest rate
for Triple-A corporate debt has declined from around 8% in the early 1990's to close to 3%.
If these findings are a fair indication of the fundamental trends in our economy, and not materially impacted by issues like survivor bias and other statistical problems, then it raises some significant questions. Among them:
(1) What impact has government policies had on ROIC versus fundamental economic trends?
Have patent laws enabled businesses to claim an unfair portion of the market? Are rounded corners on a cell phone and specific folding of cloth really "new" under law and deserving of patent protection. Has increased regulatory requirements in many industries simply raised the barriers to entry, thus enabling established businesses to charge higher prices? Was the Bush-era tax cuts the primary driver of higher ROIC, and what then do tax increases mean? Is corporate cronyism enabling certain businesses to capture excessive profit and diminishing competition?
On the other hand, did moving labor offshore provide a short-term (2-10 years) window of excess profit as costs declined while prices remained stable? Has social media improved business brand building and enabled established businesses to charge higher prices? Has technology advancements allowed a rapid decline in operating costs while allowing businesses to hold prices stable?
(2) Does ROIC return to a historically normal level, and how?
Do prices simply decline as competition intensives, suggesting deflation? Do businesses simply expand and then potentially falter as supply and demand shift to find a new equilibrium? Do government policies enable on-going elevated ROIC levels through regulation and patent law interpretation, or move to capture the excess profit through higher taxes?
(3) Was the period of 2004 to 2010 the best business environment ever?
If government policies and fundamental economic trends both favored business, and the cost of capital was historically low, could it have been any better for business? Did this excessive profit pump up the bubbles in the economy? Are these trends sustainable, or do they revert back to the historical norm? If they revert back, how long does it take and is it a headwind for the economy until equilibrium is again found?
(4) Switching to the cost of capital side, is monetary policy a coiled spring or a limp string?
Does the cost of capital suddenly spike upwards as the large build-up in excess reserves indicate inflation could rise rapidly, like a spring coiled tightly? Or, is the build-up an indication of the government "pushing on a string" to stimulate demand? Structural inefficiencies are allowing excess profit to be captured and maintained by certain businesses as competitive pressures have been weakened.
These issues are all debated in various forms, but unfortunately are usually boiled down to ridiculously simple arguments about "uncertainty."
My
point is that the cost of capital for a business has likely decreased
4-5% over the past twenty years, and likely continues to decline as the
Fed pushes long-term interest rates lower.
Basic economic theory argues that excess profit attracts competition until that profit goes away. This argument suggests that the rates of return on investment, or ROIC, have likely declined over the past 20-30 years as companies expanded and cut prices in an effort to capture the excess profit. However, I was surprised to see the statement in the book that,
Somewhat more confusing is the additional findings that,
Basic economic theory argues that excess profit attracts competition until that profit goes away. This argument suggests that the rates of return on investment, or ROIC, have likely declined over the past 20-30 years as companies expanded and cut prices in an effort to capture the excess profit. However, I was surprised to see the statement in the book that,
"The median ROIC, [excluding goodwill,] between 1963 and 2008 was around 10 percent and remained relatively constant throughout the period."
Somewhat more confusing is the additional findings that,
"However, there has been a recent shift toward more companies earning very high returns on capital, [excluding goodwill]. In the 1960s, only 1 percent of companies earned returns greater than 50 percent, whereas in the early 2000s, 14 percent of companies earned returns of that magnitude. In many cases, this improvement has occurred in industries with strong barriers to entry, such as patents or brands where gains that companies have made from decreased raw-materials prices and increased productivity have not been transferred to other stakeholders."
If these findings are a fair indication of the fundamental trends in our economy, and not materially impacted by issues like survivor bias and other statistical problems, then it raises some significant questions. Among them:
(1) What impact has government policies had on ROIC versus fundamental economic trends?
Have patent laws enabled businesses to claim an unfair portion of the market? Are rounded corners on a cell phone and specific folding of cloth really "new" under law and deserving of patent protection. Has increased regulatory requirements in many industries simply raised the barriers to entry, thus enabling established businesses to charge higher prices? Was the Bush-era tax cuts the primary driver of higher ROIC, and what then do tax increases mean? Is corporate cronyism enabling certain businesses to capture excessive profit and diminishing competition?
On the other hand, did moving labor offshore provide a short-term (2-10 years) window of excess profit as costs declined while prices remained stable? Has social media improved business brand building and enabled established businesses to charge higher prices? Has technology advancements allowed a rapid decline in operating costs while allowing businesses to hold prices stable?
(2) Does ROIC return to a historically normal level, and how?
Do prices simply decline as competition intensives, suggesting deflation? Do businesses simply expand and then potentially falter as supply and demand shift to find a new equilibrium? Do government policies enable on-going elevated ROIC levels through regulation and patent law interpretation, or move to capture the excess profit through higher taxes?
(3) Was the period of 2004 to 2010 the best business environment ever?
If government policies and fundamental economic trends both favored business, and the cost of capital was historically low, could it have been any better for business? Did this excessive profit pump up the bubbles in the economy? Are these trends sustainable, or do they revert back to the historical norm? If they revert back, how long does it take and is it a headwind for the economy until equilibrium is again found?
(4) Switching to the cost of capital side, is monetary policy a coiled spring or a limp string?
Does the cost of capital suddenly spike upwards as the large build-up in excess reserves indicate inflation could rise rapidly, like a spring coiled tightly? Or, is the build-up an indication of the government "pushing on a string" to stimulate demand? Structural inefficiencies are allowing excess profit to be captured and maintained by certain businesses as competitive pressures have been weakened.
These issues are all debated in various forms, but unfortunately are usually boiled down to ridiculously simple arguments about "uncertainty."
Tuesday, June 19, 2012
Life, Liberty, and the Avoidance of Pain
It would appear as though the markets have included the avoidance of pain as one of our inalienable rights, as outlined in the Declaration of Independence. The markets have rallied recently, apparently on the expectation of further action by the Federal Reserve. In fact, the equity markets rallied on a horrible jobs report that showed the number of job openings declined the fastest in over seven years. I know the markets are forward thinking, but this logic increasingly strikes me as strained and the equivalent of a driver excitedly accelerating the car because they see a tree ahead that will stop the car.
Maybe the Federal Reserve gives the markets all they want tomorrow. However, I struggle what would satisfy the markets. I suppose QE3 is what the market wants, but will it have an impact? If so, will the impact ultimately cause more harm than good? Sure, investment spending likely benefits from lower interest rates. But, do highly leveraged consumers need more debt? Can the people in need of low cost financing actually get it, despite the lower interest rates? I continue to believe that the Fed is losing its ability to stimulate demand, instead simply stimulating supply growth. This imbalance results in short-term boosts to the economy as businesses spend but eventually loses its steam as demand trends do not justify the increased investment spending. In short, Sagflation.
Potentially more ominous is my belief that the US economy has been built on a low interest rate foundation. What does this mean? It means that debt service has been low relative to the outstanding debt, enabling over-consumption on the demand-side and over-expansion on the supply-side. In essence, we have been painting ourselves into a corner with the only possible outcomes of depression, default or excessive inflation. Since all of these produce some form of pain, albeit in very different forms, our on-going avoidance of pain likely only leads to excessive pain in the future.
I was also amused by comments on CNBC about the housing market. The bullish bias continues as experts believe the industry should outperform the economy. Commentators take that as a bullish sign about the economy. In my view, the housing market likely outperforms only because mortgage rates keep declining, in essence enabling consumers to manage a larger debt balance and therefore pay a higher price for a house. Looking at it in reverse, when the rate on a 30-year fixed mortgage rises to the historically inexpensive 6% from the current level of around 4% the monthly interest payment for any prospective buyers increases 50%. So the Fed's actions can stimulate industries like housing for the short-term but also encourage excessive debt levels and inflates asset prices.
There is a lot of "hope" out there, but I fear this economy is living on borrowed time.
Maybe the Federal Reserve gives the markets all they want tomorrow. However, I struggle what would satisfy the markets. I suppose QE3 is what the market wants, but will it have an impact? If so, will the impact ultimately cause more harm than good? Sure, investment spending likely benefits from lower interest rates. But, do highly leveraged consumers need more debt? Can the people in need of low cost financing actually get it, despite the lower interest rates? I continue to believe that the Fed is losing its ability to stimulate demand, instead simply stimulating supply growth. This imbalance results in short-term boosts to the economy as businesses spend but eventually loses its steam as demand trends do not justify the increased investment spending. In short, Sagflation.
Potentially more ominous is my belief that the US economy has been built on a low interest rate foundation. What does this mean? It means that debt service has been low relative to the outstanding debt, enabling over-consumption on the demand-side and over-expansion on the supply-side. In essence, we have been painting ourselves into a corner with the only possible outcomes of depression, default or excessive inflation. Since all of these produce some form of pain, albeit in very different forms, our on-going avoidance of pain likely only leads to excessive pain in the future.
I was also amused by comments on CNBC about the housing market. The bullish bias continues as experts believe the industry should outperform the economy. Commentators take that as a bullish sign about the economy. In my view, the housing market likely outperforms only because mortgage rates keep declining, in essence enabling consumers to manage a larger debt balance and therefore pay a higher price for a house. Looking at it in reverse, when the rate on a 30-year fixed mortgage rises to the historically inexpensive 6% from the current level of around 4% the monthly interest payment for any prospective buyers increases 50%. So the Fed's actions can stimulate industries like housing for the short-term but also encourage excessive debt levels and inflates asset prices.
There is a lot of "hope" out there, but I fear this economy is living on borrowed time.
Monday, June 4, 2012
Expected ROIC Drives Stocks. This Likely Isn't Good for the Markets.
Spent some time during the recent market weakness listening to CNBC. Oh boy, the number of professionals simply hoping the market goes up is disturbing. Every possibly justification for higher stock prices was offered, including reversion to the mean, attractive dividend yields, low PEG, central bank intervention, and on and on. The other disturbing observation was the short sightedness of the views. Comments suggesting a Fed intervention is more likely simply avoids the fundamental issues, in my view.
Let me reiterate my very basic, but often misunderstood, argument: Expected Return On Invested Capital (ROIC) is the primary driver of stock prices, based on my experience covering stocks. PEG, dividend yield, and all other valuation measures are symptoms of the changes in ROIC, in my view.
The outlook is moving increasingly deflationary, as the PPI, CPI and PCE Index all moderate. In terms of company financials, this trend likely causes slowing revenue growth and compressing margins. For financial firms it may mean a death sentence to certain products (eg. annuities) or even firms as the yield curve flattens. Harder times for financial firms likely causes more restricted lending and liquidity, further hindering company performance and the economy.
All these trends mean falling ROIC for most companies. Falling ROIC means slowing earnings growth, cuts to dividends, worsening leverage ratios, and reduced investment spending.
I haven't even discussed debt in Europe, slowing growth in China, or the fiscal cliff at the end of this year. These topics are well covered by most financial news sources.
Sagflation - Slow to negative real economic activity combined with more volatile prices caused by aggressive monetary policies. As the "real" income of the average American slows, and even begins to decline due to excessive unemployment and mis-allocation of capital, I expect increasing deflationary pressure in the more middle-to-lower class discretionary segments of the economy as demand slows. This deflationary pressure may be offset for a time by increasingly aggressive monetary policy, but I believe more expansionary monetary policies likely disproportionately raises food and oil price, impacting debt levels of the middle to lower class. Ultimately, our monetary-policy-fueled economy becomes a snake eating its tail, in my view.
My IRA remains about 50% cash, 30% short position, and 20% long equities in specific companies expected to outperform the market.
Let me reiterate my very basic, but often misunderstood, argument: Expected Return On Invested Capital (ROIC) is the primary driver of stock prices, based on my experience covering stocks. PEG, dividend yield, and all other valuation measures are symptoms of the changes in ROIC, in my view.
The outlook is moving increasingly deflationary, as the PPI, CPI and PCE Index all moderate. In terms of company financials, this trend likely causes slowing revenue growth and compressing margins. For financial firms it may mean a death sentence to certain products (eg. annuities) or even firms as the yield curve flattens. Harder times for financial firms likely causes more restricted lending and liquidity, further hindering company performance and the economy.
All these trends mean falling ROIC for most companies. Falling ROIC means slowing earnings growth, cuts to dividends, worsening leverage ratios, and reduced investment spending.
I haven't even discussed debt in Europe, slowing growth in China, or the fiscal cliff at the end of this year. These topics are well covered by most financial news sources.
Sagflation - Slow to negative real economic activity combined with more volatile prices caused by aggressive monetary policies. As the "real" income of the average American slows, and even begins to decline due to excessive unemployment and mis-allocation of capital, I expect increasing deflationary pressure in the more middle-to-lower class discretionary segments of the economy as demand slows. This deflationary pressure may be offset for a time by increasingly aggressive monetary policy, but I believe more expansionary monetary policies likely disproportionately raises food and oil price, impacting debt levels of the middle to lower class. Ultimately, our monetary-policy-fueled economy becomes a snake eating its tail, in my view.
My IRA remains about 50% cash, 30% short position, and 20% long equities in specific companies expected to outperform the market.
Friday, June 1, 2012
Approaching the Main Event?
Performance in May was steady, increasing 1.0% for the month and 3.2% for the year-to-date. This performance is relative to the S&P 500 Index decline of 6.2% in May and a 4.2% increase for 2012. Over the past year my IRA has increased 13.2% compared to a decline of 2.6% in the S&P 500 Index.
Finally June!
My excitement may differ from other investors' excitement about turning the page on May. Right from the start of 2012 I believe I have had a clearer outlook about the second half of the year than the first half. By turning to June I believe my thesis for 2012 can begin to play out. First, a brief review of some of my comments:
On September 23, 2011, I wrote:
Looking at the news around March, 2009, when the stock markets bottomed, I was reminded that generally the economic indicators were negative. Investors, already hurt from a significant slide in the markets, were expecting the worst and in full-on survival mode. Both macro indicators and micro indicators from companies were negative. Personally, I don't think we are there yet. News out of companies remains generally okay and we have not actually tipped over in Europe or Asia. Investors remain hopeful it can be avoided. In my opinion, we may not get there until June 2012 as the full ramifications of bank failures in Europe and a slowdown in emerging markets take time to be understood.
Bottom line, I plan to exit my treasury position in the next few months. I am looking for one of the following occur: (1) 30-year treasury yields fall below 2.5% (a technical support level since it represents the low in 2008), (2) a major macroeconomic shock of the size of European sovereign debt defaults and bank failures, (3) a 30+% pullback in the equity markets, or (4) a Fed announcement about printing more money under QE3.
On February 27, 2012, I wrote:
The markets are increasingly worried about rising oil prices slowing economic growth. The rise in oil prices appears related to supply worries associated with Iran, rather than strong demand. However, the increase in the PPI for crude materials has slowed to less than 5% annually, after rising at a rate greater than 15% for the past two years. Aggressive actions by the ECB and Federal Reserve may continue to drive inflationary pressures, but I believe deflation may ultimately take over as the market driver later in 2012.
June 2012 and Beyond
Fast forward to the end of May and the yield on the ten-year treasury is near a record low and the yield on the thirty-year treasury is approaching 2.5%. Among the main driving forces behind the declining yields has been the nearing climax of the debt crisis in Europe with money exiting Europe and piling into US Treasuries. However, pricing dynamics in the US suggests inflation pressures are subsiding. Growth of PPI has continued to slow, even turning negative in April although on an annual basis the increase remained positive but slowed to 1.9%. Oil prices are falling and the CPI index is moderating. Without material actions taken by the Federal Reserve, I believe price increases likely continue to moderate and may even turn negative by the end of the year.
In summary, I believe the equity markets may soon follow the lead of the treasury market, implying the continued decline of valuations as deflationary forces increase debt burdens, slow personal income growth, and squeeze corporate margins.
Under my Sagflation thesis, I argue that the Federal Reserve is reaching the limits of its capabilities to spur demand, instead providing short-term stimulant to supply. Consumer debt was $2.52 trillion at the end of March, just shy of the all-time high of $2.59 trillion at the end of 2008. Furthermore, consumer debt increased 10% y/y in March, suggesting debt outstanding likely hits a new all-time high in the near future. Given there are 5 million fewer people working now relative to 2008, the debt outstanding appears unsustainable. The bulls argue that rising debt levels are a strong indicator of a recovering economy, supported by the the highest consumer confidence in 4 years. Fueling the optimism, in my view, has been the ability to re-finance mortgages and a more healthy job market than in recent history. But, with refinancing activity waning and job creation coming in well below expectations for May, I believe this optimism shifts back to fear.
Finally June!
My excitement may differ from other investors' excitement about turning the page on May. Right from the start of 2012 I believe I have had a clearer outlook about the second half of the year than the first half. By turning to June I believe my thesis for 2012 can begin to play out. First, a brief review of some of my comments:
On September 23, 2011, I wrote:
Looking at the news around March, 2009, when the stock markets bottomed, I was reminded that generally the economic indicators were negative. Investors, already hurt from a significant slide in the markets, were expecting the worst and in full-on survival mode. Both macro indicators and micro indicators from companies were negative. Personally, I don't think we are there yet. News out of companies remains generally okay and we have not actually tipped over in Europe or Asia. Investors remain hopeful it can be avoided. In my opinion, we may not get there until June 2012 as the full ramifications of bank failures in Europe and a slowdown in emerging markets take time to be understood.
Bottom line, I plan to exit my treasury position in the next few months. I am looking for one of the following occur: (1) 30-year treasury yields fall below 2.5% (a technical support level since it represents the low in 2008), (2) a major macroeconomic shock of the size of European sovereign debt defaults and bank failures, (3) a 30+% pullback in the equity markets, or (4) a Fed announcement about printing more money under QE3.
On February 27, 2012, I wrote:
The markets are increasingly worried about rising oil prices slowing economic growth. The rise in oil prices appears related to supply worries associated with Iran, rather than strong demand. However, the increase in the PPI for crude materials has slowed to less than 5% annually, after rising at a rate greater than 15% for the past two years. Aggressive actions by the ECB and Federal Reserve may continue to drive inflationary pressures, but I believe deflation may ultimately take over as the market driver later in 2012.
June 2012 and Beyond
Fast forward to the end of May and the yield on the ten-year treasury is near a record low and the yield on the thirty-year treasury is approaching 2.5%. Among the main driving forces behind the declining yields has been the nearing climax of the debt crisis in Europe with money exiting Europe and piling into US Treasuries. However, pricing dynamics in the US suggests inflation pressures are subsiding. Growth of PPI has continued to slow, even turning negative in April although on an annual basis the increase remained positive but slowed to 1.9%. Oil prices are falling and the CPI index is moderating. Without material actions taken by the Federal Reserve, I believe price increases likely continue to moderate and may even turn negative by the end of the year.
In summary, I believe the equity markets may soon follow the lead of the treasury market, implying the continued decline of valuations as deflationary forces increase debt burdens, slow personal income growth, and squeeze corporate margins.
Under my Sagflation thesis, I argue that the Federal Reserve is reaching the limits of its capabilities to spur demand, instead providing short-term stimulant to supply. Consumer debt was $2.52 trillion at the end of March, just shy of the all-time high of $2.59 trillion at the end of 2008. Furthermore, consumer debt increased 10% y/y in March, suggesting debt outstanding likely hits a new all-time high in the near future. Given there are 5 million fewer people working now relative to 2008, the debt outstanding appears unsustainable. The bulls argue that rising debt levels are a strong indicator of a recovering economy, supported by the the highest consumer confidence in 4 years. Fueling the optimism, in my view, has been the ability to re-finance mortgages and a more healthy job market than in recent history. But, with refinancing activity waning and job creation coming in well below expectations for May, I believe this optimism shifts back to fear.
Tuesday, May 1, 2012
April was About Positioning, Nullifying Performance
My IRA was basically flat in April as I built up positions in Chesapeake Energy (Ticker CHK) as the stock declined. At the end of the month about 5.5% of my IRA was invested in CHK. Offsetting this decline was better performance by my ~30% position in the ETF Proshares Short S&P 500 (Ticker SH), which increased modestly as the index declined about 1.5% during the month.
I also exited all of my bond positions as the lack of liquidity became more concerning and I wanted to reduce my long positions as we approach June, a potential turn in the market in my view. My bearish view includes a worsening outlook for economic activity in Europe, a combination of potentially higher taxes and reduced government spending in the US starting in 2013, and on-going mis-allocation of resources in China producing a shock to the markets. As we enter the second half of 2012 I believe these issues begin to increasingly dominate market movements.
Besides the short positions and CHK, at the end of the month my exposure includes ~6% in commodities, ~10% equities, and ~49% cash.
On an annual basis, my IRA increased about 14.5%.
I also exited all of my bond positions as the lack of liquidity became more concerning and I wanted to reduce my long positions as we approach June, a potential turn in the market in my view. My bearish view includes a worsening outlook for economic activity in Europe, a combination of potentially higher taxes and reduced government spending in the US starting in 2013, and on-going mis-allocation of resources in China producing a shock to the markets. As we enter the second half of 2012 I believe these issues begin to increasingly dominate market movements.
Besides the short positions and CHK, at the end of the month my exposure includes ~6% in commodities, ~10% equities, and ~49% cash.
On an annual basis, my IRA increased about 14.5%.
Wednesday, April 18, 2012
Which Comes First? Market Correction or Fed Stimulus with Abating Inflation Pressure
Is inflation or deflation the biggest threat to the economies of the world? In a word: both, in my view when the economy is in Sagflation.
Fundamentally, deflation is the driving force in many economies as poor capital allocations of the past need to be worked off, in my view, potentially pushing us into a depression. However, I believe expansionary fiscal and monetary policies have been offsetting these fundamental forces by pushing up commodity prices, enabling inefficient business activity, and inflating financial assets. These effects from monetary policies increase the risk of hyper-inflation if extended and amplified, in my view. In summary, I believe the combination of fundamental economic forces and activist policies push us further and further into a world of volatile prices and uneven economic activity.
In this entry I again borrow the framework developed by A. Gary Schilling on inflation to breakdown the trends and hopefully glean a bit more insight into the future. His framework breaks down inflationary/ deflationary pressures into seven areas, which are commodity, wage-price, financial assets, tangible assets, currency, fiat, and goods and services. Mr. Schilling has argued a deflationary period is ahead for the world, most recently in his book published in late 2010 titled, "The Age of Deleveraging."
My conclusion is that while inflationary fears are justified for basic necessities, like healthcare, food and fuel, the broader trend is deflationary as growth in wages, commodities, and asset values moderate and even decline. The Federal Reserve has been focused on broad measures of inflation, which include material weighting of asset values and wages, and thus I expect the Federal Reserve to launch another round of quantitative easing should these factors continue to weaken, possibly at the expense of higher prices for fuel and food, which may further erode real economic activity.
Summary Table
Commodity
The pace of growth of commodity prices has been moderating, likely due to weakening demand in Europe as the debt overhang and austerity measures begin to bite. It remains unclear whether the slowdown in Europe spreads to China and resource-rich countries like Brazil should commodity prices continue to fall.

Wage-Price
The rate of growth of wages has been moderating to under 2%, putting pressure on spending despite some improvement in the number of people employed. The slowdown in wage growth in itself is deflationary, but its impact is likely uneven as higher prices for necessities like fuel, food and healthcare force both higher consumer debt, aided initially by low interest rates, and stronger deflationary pressures in more discretionary segments.


Financial Assets
Financial assets are modestly inflated, based on historical valuations of total market capitalization to GDP and the Shiller PE ratio. The current ratio of total market capitalization to GDP is above 95%, relative to a historically fair value of 75-90%. The current Shiller PE ratio is about 22x, compared to a historical mean of 16x. The market is relatively over-valued largely due to aggressive monetary policies, in my view, pumping up liquidity in the markets. Furthermore, should the economy slow in order to allow for what I consider to be an over due capital rationalization, the total market capitalization likely retreats 40-60% as both the GDP and earnings compress. While the equity markets may remain fairly-to-overvalued for some time, I believe there is an inflating air pocket under supporting these valuations as GDP is artificially increased through monetary actions.
Tangible Assets
Home prices continue to deflate in the country, despite historic low mortgage rates. While there are numerous investors trying to "call the bottom" on home prices, I believe it is difficult to argue for higher home values should monetary policies allow interest rates to rise. As people lose more equity in their homes it is difficult to see from where additional spending can be funded, in my view. Judging by the April Homebuilders' Index reading of 25, anything below 50 is considered negative, a recovery in the housing market is a long way off.

Currency
The longer-term trend is a weakening US dollar, likely driven by the expansionary monetary policy. This longer-term trend adds inflationary pressures to the economy. Shorter-term, however, the US dollar has strengthened as other regions have weakened and pursued more aggressive monetary tactics. This recent strengthening has added deflationary pressures to the economy as the prices of imported goods become relatively lower.

Fiat
The US economy continues to benefit from overwhelmingly inflationary fiscal and monetary policies. Deficit spending, fueled by both relatively low tax rates and stimulus, has enabled economic activity to remain elevated, in my view. Furthermore, expansionary monetary policies have enabled poorly performing businesses to remain in viable and has added to the money supply.
While fiscal and monetary policies have been inflationary, they potentially turn deflationary in 2013 when significant tax increases and spending cuts are expected to come into effect.
Goods and Services
As I discussed in March, investors should look at the inflation of goods and services through two lenses. The first is the traditional inflationary measures impacting the consumer, which are the CPI and Personal Consumption Expenditures Price Index (PCEPI). These are the measures on which the Federal Reserve typically focuses when determining monetary policies. Both show a trend of abating inflationary pressure.


The second, and better measure of the impact of monetary policies in my view, is the AIER Everyday Price Index (EPI), which highlights increased volatility of prices and higher inflationary pressure on middle to lower class income levels. The EPI increased 8% in 2011, relative to a 3% increase in the CPI, and increased 1.3% and 1.1% in January and February. The increases in the EPI are also moderating, although AIER expects them to continue to accelerate throughout this year and next. Based on the moderation of commodities, I expect the increase in EPI may moderate as well.
The last point on goods and services is a possible signal that demand is slowing. Industrial production declined 0.2% in March. This data may be a blip, but it is worth following as a sign of whether the economy is again cooling.
Fundamentally, deflation is the driving force in many economies as poor capital allocations of the past need to be worked off, in my view, potentially pushing us into a depression. However, I believe expansionary fiscal and monetary policies have been offsetting these fundamental forces by pushing up commodity prices, enabling inefficient business activity, and inflating financial assets. These effects from monetary policies increase the risk of hyper-inflation if extended and amplified, in my view. In summary, I believe the combination of fundamental economic forces and activist policies push us further and further into a world of volatile prices and uneven economic activity.
In this entry I again borrow the framework developed by A. Gary Schilling on inflation to breakdown the trends and hopefully glean a bit more insight into the future. His framework breaks down inflationary/ deflationary pressures into seven areas, which are commodity, wage-price, financial assets, tangible assets, currency, fiat, and goods and services. Mr. Schilling has argued a deflationary period is ahead for the world, most recently in his book published in late 2010 titled, "The Age of Deleveraging."
My conclusion is that while inflationary fears are justified for basic necessities, like healthcare, food and fuel, the broader trend is deflationary as growth in wages, commodities, and asset values moderate and even decline. The Federal Reserve has been focused on broad measures of inflation, which include material weighting of asset values and wages, and thus I expect the Federal Reserve to launch another round of quantitative easing should these factors continue to weaken, possibly at the expense of higher prices for fuel and food, which may further erode real economic activity.
Summary Table
| Segment | Trend |
| Commodity | Abating Inflation Pressure |
| Wage-Price | Abating Inflation Pressure |
| Financial Assets | Inflation |
| Tangible Assets | Deflation |
| Currency | LT Inflation, ST Deflation |
| Fiat | 2012 Inflation, 2013 Possibly Deflation |
| Goods and Services | Abating Broad Inflation Pressure |
Commodity
The pace of growth of commodity prices has been moderating, likely due to weakening demand in Europe as the debt overhang and austerity measures begin to bite. It remains unclear whether the slowdown in Europe spreads to China and resource-rich countries like Brazil should commodity prices continue to fall.

Wage-Price
The rate of growth of wages has been moderating to under 2%, putting pressure on spending despite some improvement in the number of people employed. The slowdown in wage growth in itself is deflationary, but its impact is likely uneven as higher prices for necessities like fuel, food and healthcare force both higher consumer debt, aided initially by low interest rates, and stronger deflationary pressures in more discretionary segments.


Financial Assets
Financial assets are modestly inflated, based on historical valuations of total market capitalization to GDP and the Shiller PE ratio. The current ratio of total market capitalization to GDP is above 95%, relative to a historically fair value of 75-90%. The current Shiller PE ratio is about 22x, compared to a historical mean of 16x. The market is relatively over-valued largely due to aggressive monetary policies, in my view, pumping up liquidity in the markets. Furthermore, should the economy slow in order to allow for what I consider to be an over due capital rationalization, the total market capitalization likely retreats 40-60% as both the GDP and earnings compress. While the equity markets may remain fairly-to-overvalued for some time, I believe there is an inflating air pocket under supporting these valuations as GDP is artificially increased through monetary actions.
| Valuation | Ratio = Total Market Cap / GDP |
|---|---|
| Ratio < 50% | Significantly Undervalued |
| 50% < Ratio < 75% | Modestly Undervalued |
| 75% < Ratio < 90% | Fair Valued |
| 90% < Ratio < 115% | Modestly Overvalued |
| 115% < Ratio | Significantly Overvalued |
Tangible Assets
Home prices continue to deflate in the country, despite historic low mortgage rates. While there are numerous investors trying to "call the bottom" on home prices, I believe it is difficult to argue for higher home values should monetary policies allow interest rates to rise. As people lose more equity in their homes it is difficult to see from where additional spending can be funded, in my view. Judging by the April Homebuilders' Index reading of 25, anything below 50 is considered negative, a recovery in the housing market is a long way off.

Currency
The longer-term trend is a weakening US dollar, likely driven by the expansionary monetary policy. This longer-term trend adds inflationary pressures to the economy. Shorter-term, however, the US dollar has strengthened as other regions have weakened and pursued more aggressive monetary tactics. This recent strengthening has added deflationary pressures to the economy as the prices of imported goods become relatively lower.

Fiat
The US economy continues to benefit from overwhelmingly inflationary fiscal and monetary policies. Deficit spending, fueled by both relatively low tax rates and stimulus, has enabled economic activity to remain elevated, in my view. Furthermore, expansionary monetary policies have enabled poorly performing businesses to remain in viable and has added to the money supply.
While fiscal and monetary policies have been inflationary, they potentially turn deflationary in 2013 when significant tax increases and spending cuts are expected to come into effect.
Goods and Services
As I discussed in March, investors should look at the inflation of goods and services through two lenses. The first is the traditional inflationary measures impacting the consumer, which are the CPI and Personal Consumption Expenditures Price Index (PCEPI). These are the measures on which the Federal Reserve typically focuses when determining monetary policies. Both show a trend of abating inflationary pressure.


The second, and better measure of the impact of monetary policies in my view, is the AIER Everyday Price Index (EPI), which highlights increased volatility of prices and higher inflationary pressure on middle to lower class income levels. The EPI increased 8% in 2011, relative to a 3% increase in the CPI, and increased 1.3% and 1.1% in January and February. The increases in the EPI are also moderating, although AIER expects them to continue to accelerate throughout this year and next. Based on the moderation of commodities, I expect the increase in EPI may moderate as well.
The last point on goods and services is a possible signal that demand is slowing. Industrial production declined 0.2% in March. This data may be a blip, but it is worth following as a sign of whether the economy is again cooling.
Thursday, April 12, 2012
Expanded Long Position in Natural Gas Segment
This morning, after the DOE announced that the inventory for natural gas was well below market expectations, I expanded my position in EnCana Corporation (Ticker ECA) and established a position in Chesapeake Energy Corporation (Ticker CHK). At the end of the day I have a combined ~5% position in these natural gas-related companies. I expect these positions to remain in my IRA for at least one year, unless natural gas prices continue to fall or the stock prices appreciate back to near 52-week highs. I may establish additional positions related to natural gas that could increase my exposure to 10-20% of my IRA.
This morning the US Energy Department announced that natural gas inventory increased by 8 billion cubic feet, lower than the anticipated 19-25 Bcf. While inventory remains well above historical averages, my take on the data is that the recent declines in rig count is (1) slowing the growth of inventory, and (2) the market estimates likely are too high for future inventory increases. At this time of year the inventory of natural gas typically increases due to milder weather, but with the glut of inventory many producers have been shutting down rigs, as highlighted in my previous article.
Natural gas prices remained weak during the day. However, I believe the lower than expected inventory build combined with rig closures likely signals more balance between supply and demand and could even lead to a higher rate of draw down of inventory during the summer if the weather is unseasonably hot. All that said, natural gas prices may not appreciate materially until next year, as highlighted by Goldman Sachs today.
Under my Sagflation theme I expect more volatility in prices, thus I would not be surprised if natural gas prices do not remain around $2 for long.
This morning the US Energy Department announced that natural gas inventory increased by 8 billion cubic feet, lower than the anticipated 19-25 Bcf. While inventory remains well above historical averages, my take on the data is that the recent declines in rig count is (1) slowing the growth of inventory, and (2) the market estimates likely are too high for future inventory increases. At this time of year the inventory of natural gas typically increases due to milder weather, but with the glut of inventory many producers have been shutting down rigs, as highlighted in my previous article.
Natural gas prices remained weak during the day. However, I believe the lower than expected inventory build combined with rig closures likely signals more balance between supply and demand and could even lead to a higher rate of draw down of inventory during the summer if the weather is unseasonably hot. All that said, natural gas prices may not appreciate materially until next year, as highlighted by Goldman Sachs today.
Under my Sagflation theme I expect more volatility in prices, thus I would not be surprised if natural gas prices do not remain around $2 for long.
Wednesday, April 11, 2012
Natural Gas Market Dynamics Suggest Price Rebound
The price of natural gas continues to slide downwards as production remains high and consumers benefit from mild weather, reducing their need for the fuel. This continuing trend would appear unfavorable for many of the natural gas companies, including Chesapeake Energy Corporation (Ticker CHK) and EnCana Corporation (Ticker ECA). Indeed, the stock prices of these companies have continued to slide over the past month as investors worry about the financial impact.
Furthermore, a recent article in the Wall Street Journal highlights that storage for natural gas is expected to reach capacity before the end of the year if production does not slow down and the weather remains mild. This highlights that the price of natural gas in the US is determined more on short-term supply-demand trends due to an inability to store large amounts of the gas. It also highlights that something has to give because companies likely won't simply blow the excess into the atmosphere, accept negative prices, or some other crazy market scenario. Under my Sagflation theme, I expect more volatile prices, especially for commodities, and thus a strong rebound in natural gas prices would not be surprising, in my view.
Investing in a company that produces natural gas would seem foolhardy with the price of natural gas around $2, the lowest in about 10 years, and supply apparently continuing to outpace demand. But, there are signs that drilling is slowing and demand may pick-up. With limited storage capacity, making prices more volatile, this shift in supply-demand potentially precedes a turn-around in natural gas prices later in 2012 and 2013. For these reasons I have begun to build long positions in natural gas companies, initially a small position in EnCana Corp. with a 4% dividend yield.
Let's go through some market dynamics of natural gas:
(1) Demand likely increasing
There are four basic domestic users of natural gas, which are (1) Homes for heating, hot water, appliances, (2) Businesses for heating, hot water, appliances, (3) Commercial for manufacturing, and (4) Electricity production. The only one of these four segments that has grown over the past decade is electricity production. The first two segments have remained relatively flat due to improved efficiency through better furnaces and insulation. Industrial demand has slid, most likely due to the shift of manufacturing overseas.
An increasing number of electric power plants may shift to natural gas as an alternative to coal as the price for natural gas falls. Energy analysts at Sanford Bernstein estimate that electric utilities may increase consumption of natural gas by 13.5% in 2012 as they switch from coal. This is likely driven by the falling price of natural gas. As discussed on the Wall Street Journal, the market is already pushing electricity producers towards building additional gas-fired plants. But, referring back to the fact that natural gas prices are set more based on short-term market dynamics than long-term, there is greater risk relying solely on gas-fired plants because prices may increase dramatically in the future.
Furthermore, if a recent ruling by the EPA stands-up, then more utilities may be forced to shift to natural gas as a greater amount of the externality costs associated with the use of coal, and its larger release of carbon dioxide, are captured in the price of electricity. However, I believe this ruling is unlikely to stand-up to scrutiny by Congress given the outrage from the coal producers.
Another potentially major driver of demand in the near-term is increased exporting of the fuel as more ports come on-line with the ability to export the fuel. To export natural gas is to invite political scrutiny, and some debate about the advantages and disadvantages of creating a world market for natural gas. However, producers likely push hard to open up new markets that are willing to pay three to four times the price in the US. Simple market dynamics suggests that if the US does begin exporting natural gas, and thus creating more of a world market, the relatively low prices in the US likely rise and the relatively higher prices in Asia likely decline.
Longer-term an increasing number of industries may begin relying more heavily on natural gas, should manufacturing in the US continue to pick-up. Additionally, a device that allows fueling of cars with natural gas from the home may eventually prove a major driver of natural gas demand. A stimulant to home refueling could be a tax incentive towards purchasing the home device.
(2) Drilling for dry natural gas slows
There are signs that drilling for natural gas has slowed. Baker Hughes recently announced the company expects lower operating profit in the first quarter due to rapid transition in drilling away from natural gas towards oil. Indeed, the rig count for natural gas has fallen to a ten-year low of 647, relative to the 2011 high of 936 and all-time high of 1,606 in 2008. With production down around 60% from the all-time high, and continuing to decline, I believe natural gas prices should turn around.
Chesapeake Energy Corp, the second largest producer of natural gas behind Exxon Mobil Corp, has allocated approximately 85% of capital expenditures in 2012 toward crude oil and liquid natural gas resources, up from 10% in 2009. Comstock Resources (Ticker CRK), with 85% of its reserves in natural gas, has shifted to oil production with 77% of its 2012 drilling budget devoted to oil production. Devon Energy Corporation (Ticker DVN), with about 60% of its reserves in dry natural gas, has cleared much of its rigs out of natural gas production sites and has said the company is not "investing in new wells in a $2 market."
While a significant amount of natural gas continues to be produced as a by-product of oil drilling, this highlights that the trend is downward in natural gas production. It also potentially creates excess supply in the NGL market and may ultimately result in a strong rebound in natural gas prices when demand picks up.
Furthermore, a recent article in the Wall Street Journal highlights that storage for natural gas is expected to reach capacity before the end of the year if production does not slow down and the weather remains mild. This highlights that the price of natural gas in the US is determined more on short-term supply-demand trends due to an inability to store large amounts of the gas. It also highlights that something has to give because companies likely won't simply blow the excess into the atmosphere, accept negative prices, or some other crazy market scenario. Under my Sagflation theme, I expect more volatile prices, especially for commodities, and thus a strong rebound in natural gas prices would not be surprising, in my view.
Investing in a company that produces natural gas would seem foolhardy with the price of natural gas around $2, the lowest in about 10 years, and supply apparently continuing to outpace demand. But, there are signs that drilling is slowing and demand may pick-up. With limited storage capacity, making prices more volatile, this shift in supply-demand potentially precedes a turn-around in natural gas prices later in 2012 and 2013. For these reasons I have begun to build long positions in natural gas companies, initially a small position in EnCana Corp. with a 4% dividend yield.
Let's go through some market dynamics of natural gas:
(1) Demand likely increasing
There are four basic domestic users of natural gas, which are (1) Homes for heating, hot water, appliances, (2) Businesses for heating, hot water, appliances, (3) Commercial for manufacturing, and (4) Electricity production. The only one of these four segments that has grown over the past decade is electricity production. The first two segments have remained relatively flat due to improved efficiency through better furnaces and insulation. Industrial demand has slid, most likely due to the shift of manufacturing overseas.
An increasing number of electric power plants may shift to natural gas as an alternative to coal as the price for natural gas falls. Energy analysts at Sanford Bernstein estimate that electric utilities may increase consumption of natural gas by 13.5% in 2012 as they switch from coal. This is likely driven by the falling price of natural gas. As discussed on the Wall Street Journal, the market is already pushing electricity producers towards building additional gas-fired plants. But, referring back to the fact that natural gas prices are set more based on short-term market dynamics than long-term, there is greater risk relying solely on gas-fired plants because prices may increase dramatically in the future.
Furthermore, if a recent ruling by the EPA stands-up, then more utilities may be forced to shift to natural gas as a greater amount of the externality costs associated with the use of coal, and its larger release of carbon dioxide, are captured in the price of electricity. However, I believe this ruling is unlikely to stand-up to scrutiny by Congress given the outrage from the coal producers.
Another potentially major driver of demand in the near-term is increased exporting of the fuel as more ports come on-line with the ability to export the fuel. To export natural gas is to invite political scrutiny, and some debate about the advantages and disadvantages of creating a world market for natural gas. However, producers likely push hard to open up new markets that are willing to pay three to four times the price in the US. Simple market dynamics suggests that if the US does begin exporting natural gas, and thus creating more of a world market, the relatively low prices in the US likely rise and the relatively higher prices in Asia likely decline.
Longer-term an increasing number of industries may begin relying more heavily on natural gas, should manufacturing in the US continue to pick-up. Additionally, a device that allows fueling of cars with natural gas from the home may eventually prove a major driver of natural gas demand. A stimulant to home refueling could be a tax incentive towards purchasing the home device.
(2) Drilling for dry natural gas slows
There are signs that drilling for natural gas has slowed. Baker Hughes recently announced the company expects lower operating profit in the first quarter due to rapid transition in drilling away from natural gas towards oil. Indeed, the rig count for natural gas has fallen to a ten-year low of 647, relative to the 2011 high of 936 and all-time high of 1,606 in 2008. With production down around 60% from the all-time high, and continuing to decline, I believe natural gas prices should turn around.
Chesapeake Energy Corp, the second largest producer of natural gas behind Exxon Mobil Corp, has allocated approximately 85% of capital expenditures in 2012 toward crude oil and liquid natural gas resources, up from 10% in 2009. Comstock Resources (Ticker CRK), with 85% of its reserves in natural gas, has shifted to oil production with 77% of its 2012 drilling budget devoted to oil production. Devon Energy Corporation (Ticker DVN), with about 60% of its reserves in dry natural gas, has cleared much of its rigs out of natural gas production sites and has said the company is not "investing in new wells in a $2 market."
While a significant amount of natural gas continues to be produced as a by-product of oil drilling, this highlights that the trend is downward in natural gas production. It also potentially creates excess supply in the NGL market and may ultimately result in a strong rebound in natural gas prices when demand picks up.
Subscribe to:
Posts (Atom)