The economy of Spain may be edging towards something pretty ugly. A 23+% unemployment rate, negative GDP growth, and upwards of Debt/GDP of 133% (about 70% if excluding European liabilities) is a recipe for an implosion, in my view. The cherry on the top may come tomorrow when the government is expected to announce deeper cuts in government spending. For an economy heavily reliant on government spending, which accounts for approximately 40% of GDP, and the 12th largest economy in the world, this is something to take seriously. While Greece was significant, Spain could actually pull down some other economies should it implode.
My suspicion is that the markets may downplay the risks for a few months until investors can no longer ignore the potential damage. The level of bullish commentary in the media has been quite high lately and it may take some time to remove the froth. That said, this week I increased my short exposure and trimmed some of my corporate bonds. Currently my portfolio is as follows:
Short S&P 500 (ETF ticker SH) ~ 30%
Corporate Bonds ~ 28%
Commodities (Gold and Agriculture) ~ 8%
Equity ~ 7%
Cash ~ 27%
Thursday, March 29, 2012
Wednesday, March 28, 2012
Mr. Bernanke Likely Stinks at Angry Birds
Trying to teach my three year old to play Angry Birds was initially rather frustrating. She was more enamored with the slingshot rather than actually trying to knock anything down. Not surprising since she is three years old, after all. But, this meant she typically pulled back the sling shot in random directions, often repeatedly driving the bird directly into the ground. While frustrating to watch, it seemed to please her and she eventually became more focused on knocking down structures. Now it is frustrating that my still three old daughter is better at Angry Birds than me.
I was reminded of my daughter while reading about Mr. Bernanke's recent comments on monetary policy. Monetary policy is somewhat like a sling shot. The Fed stimulates the economy by pulling back and releasing on the rubber band by cutting interest rates and letting the economy fly forward. While the economy arcs through the air the Fed can re-load the energy in the slingshot by raising interest rates for when the economy next slows. I recognize this is not a perfect analogy because the Fed is not trying to hit a specific target in the distance but instead trying to reach a certain height, or inflation/ unemployment level, while maximizing the distance of the arc, or period of time.
The reason for offering the Angry Birds analogy is that I believe the Fed's slingshot is stretched out and the bird/ economy is getting heavier. By repeatedly trying to snap the economy higher the Fed has stretched out its slingshot, in my view. Furthermore, by allowing on-going inefficient capital allocations in the economy through repeated stimulation at the initial signs of slower economic growth, the dead-weight in the economy has increased. I believe these combined issues have deteriorated the Fed's slingshot to where it must "aim higher" in order to reach the desired economic lift, at the expense of the distance in the arc. My fear is that soon the Fed may need to pull straight down in an attempt to push the economy to the desired height, resulting in a brief and ultimately unsuccessful boost. In other words, the much desired "escape velocity" for the economy is becoming more and more remote.
But my concerns expanded recently after recent speeches by Mr. Ben Bernanke. On March 22 Federal Chairman Mr. Ben Bernanke gave a speech at George Washington University in which he claimed "monetary policy did not play an important role in raising house prices during the upswing."
This comment is somewhat confusing and increases my feeling of unease. My initial interpretation is that Mr. Bernanke is becoming more concerned with how people perceive him than actually ignoring the political pressures, learning from history, and applying a critical analysis to improving actions in the future.
The fundamental role of the Federal Reserve, as I see it, is to impact the expansion or contraction of credit in the economy to provide price stability and full employment. For the Chairman to claim monetary policies do not have an impact on credit availability in certain segments of the economy, and thus economic expansion, implies either he believes monetary policy is irrelevant or extremely specific in its application. Both implications strain credibility, in my mind.
That said, I believe Mr. Bernanke was offering a Goldilocks explanation, in which monetary policy was just right to stimulate demand but structural problems resulted in housing over-heating. While convenient for his legacy, I believe this explanation actively ignores the Fed's role in the economy. By side-stepping deeper recessions over the past few decades the Federal Reserve has encouraged inefficient or out-dated economic structures to remain in the economy. Furthermore, if Mr. Bernanke believes the problem is structural, then to continue pursuing aggressive monetary policies when one knows there are problems is like a builder adding another level to a house when they know the foundation is weak. The risk increases of it all coming crashing down.
I raise this comment to make the following points:
(1) The Federal Reserve policies remain a hammer looking for a nail.
(2) Significant structural inefficiencies have likely continued to build up in the economy.
(3) The root cause of Sagflation likely remains in place, which is overly aggressive monetary policies enabling the inefficient allocation of capital. This likely produces heightened price volatility with stronger swings between inflation and deflation.
To return to my Angry Bird analogy, my expanded fear is that the Federal Reserve is becoming less concerned about its "aim," and more enamored with how to stretch the slingshot further in order to try and recover the power of its snap. Much like my daughter who found she could pull the slingshot back further if she pulled it straight-up, I now fear that the Federal Reserve may begin to start aiming at the ground in order to stretch the band further. Whether this leads to deflation or excessive inflation is yet to be determined, but real economic growth likely suffers.
One last point I'd like to make clear. In my view, Congress clearly is a major part of the problem due to its difficulty in passing legislation, the influence of special interest money, and inflexible bipartisan positions. In many ways, Congress represents the crumbling foundation. That said, the Federal Reserve is enabling the problems to fester and deepen, possibly creating a larger issue in the future, in my view.
Thursday, March 15, 2012
Bought More Gold During a Period of Calm
Given the recent pullback in gold, yesterday I increased my position in iShares Gold Trust (Ticker: IAU) to ~5% of my IRA. The reasons for my increasingly bullish position are the following:
(1) Gold has pulled back almost 10% since its end of February peak.
(2) I do not believe aggressive US monetary policies have ended, and in fact the current policies remain quite expansionary.
(3) I do not expect the US economy to accelerate from here. If anything, I expect at least a few more bumps in the road later in the year. As I detailed in the post about Okun's Law, I believe the current health of the economy is much more about monetary policy driving supply growth, instead of fundamental consumer demand growth.
I am also keeping my eyes on treasuries and may establish a long position if yields on the 30-year rise above 3.5%. If my Sagflation theme plays out then I expect increasing deflationary pressure over the next couple years, unless the Federal Reserve begins aggressively adding to the monetary base through treasury purchases. In either case, I believe yields on the 30-year treasury have at least one more trip well below 3.0%.
Another segment is natural gas. I continue to consider possible plays on the low prices of natural gas, and the likely rebound in prices, in my view. Playing gas prices through an ETF proved quite inefficient and thus I am considering equity positions in natural gas companies. However, I feel a need for patience until the natural gas market firms up a bit more and stocks like Chesapeake (Ticker CHK) and Encana (Ticker ECA) to fall further. At this point I believe these stocks are lifted more by broad market trends than actual fundamentals.
Wednesday, March 14, 2012
Broken Okun's Law May be Sign of Unsustainable Supply Driven Economy
I believe my Sagflation theme explains this breakdown, and offers an opportunity to look at Sagflation from a slightly different perspective. In summary, I believe the apparent breakdown in Okun's Law is an unsustainable situation in which supply is growing due to inexpensive credit (encouraging hiring) but demand is relatively stagnant due to historically high consumer debt levels (slow growth), resulting in falling productivity.
To get into the details let's review a couple key facts:
(1) Consumer debt ratio is relatively high: Consumer debt to after-tax income is 113% compared to an average of 85% during the 1990's. Debt service payments to income shows a healthier picture but if consumers are expecting interest rates to rise then they may focus more on the absolute level of debt rather than the debt service. That said, if the consumer believes interest rates may remain low for an extended period, which is the strategy of the Federal Reserve, then demand may increase for a period until either rates increase or expectations of rate increases begin. While debt-driven spending may drive markets for a period of time, this possible belief of low and stable interest rates is misplaced and temporary, in my opinion, and likely results in larger issues later on after debt levels have increased. Therefore, over the long-term I believe the historically high level of debt hinders economic growth.
Source: Federal Reserve
(2) Corporate balance sheets are relatively healthy: Whether it is the record $1.2 trillion in cash on company balance sheets, or the record low yields on corporate debt, corporations are swimming in a deep pool of liquidity. This abundance of inexpensive capital enables companies to invest aggressively in their business, both offensively to take market share or defensively to avoid market share loss. Furthermore, I believe companies are encouraged to pursue riskier projects in search of returns, similar to how investors seem to be moving into higher risk asset classes. Indeed, capital expenditures have risen to levels near the peak prior to the start of the 2007 recession.
(3) Labor productivity moderation: At 0.4%, output per hour of labor grew at the smallest rate in 2011 of any year during the past decade. By BLS estimates, productivity actually turned negative in the first half of 2011. The slowing productivity improvements are one of the primary reasons many propose as the reason for the breakdown in Okun's Law. However, I believe it is merely a symptom of Sagflation rather than cause.
.png)
Source: Bureau of Labor Statistics
To review my Sagflation thesis,
Sagflation, as I define it, is moderate to negative real economic growth combined with more volatile prices. The reasons for the relatively slow growth is a combination of a build-up in poorly allocated capital, creating excess supply, and subdued demand associated with a build-up of excessive debt. The price volatility is primarily a result of an overly aggressive monetary policy that repeatedly attempts to expand credit despite excesses in the economy.
The simple answer to the apparent breakdown between unemployment and economic growth is that the long-term sustainable growth rate of the economy may have declined. Thus when economic activity picks up even a bit the unemployment rate eases. This simple answer allows for the long history of Okun's Law to remain intact.
Of course the question then becomes, why has the long-term sustainable growth rate of the economy declined. In my mind, the answer is the causes of Sagflation, which are (a) high consumer debt levels, plus a (b) build-up of excessive supply, which both were encouraged by an (c) overly aggressive monetary policy.
The Federal Reserve has been encouraging investment spending by lowering interest rates. However, consumers hurt by the housing bust may be less willing to ramp-up purchases just because they have available credit. Instead, consumers may be more focused on their debt balance and the potential for interest rats to rise in the future. Therefore, demand stimulation has exhibited diminishing returns from monetary policies.
Businesses, however, generally have healthy balance sheets and access to inexpensive financing. Competition is driving investment spending as market share remains a primary concern. Given a relatively low cost of capital, businesses can continue to invest capital despite possibly slowing sales growth and shrinking margins. Thus excess capital continues to build-up in areas of the economy, along with employees to provide service, despite relatively weak economic fundamentals. Productivity declines as each additional man hour brings in fewer sales because demand has not been stimulated.
While not sustainable, if supply continues to grow and demand remains stagnant, you might expect to see weak economic growth, falling unemployment, and falling productivity.
Friday, March 9, 2012
Everyday Price Index (EPI) Helps Illustrate Sagflation
An interesting gauge of inflation is the Everyday Price Index, or EPI. This measurement has recently received more interest lately because it shows an increase of 8% in prices last year, thus raising fears of hyper-inflation.
The EPI is calculated by the American Institute of Economic Research to address a concern that the CPI does not fairly reflect the price fluctuations impacting day-to-day consumers. The EPI tracks common household items purchased frequently, such as food, fuel and toothpaste.
To start, any measure of inflation has its flaws, so one must tread lightly when highlighting these measurements. For example, the EPI is biased towards more inelastic prices, or products less impacted by economic cycles, because it focuses more on non-discretionary items. Secondly, the EPI is weighted heavily to food and beverages (38-47% of the EPI), and motor fuel and transportation (14-20%). Thus the index is much more sensitive to changes in the relatively volatile commodity prices. It also minimizes the effect of many sectors experiencing deflationary forces, such as technology and manufacturing. All that said, it does offer some insight into interesting trends.
The EPI highlights a couple trends I have been arguing under my Sagflation theme of slow to negative real economic activity combined with more volatile prices caused by aggressive monetary policies. As the "real" income of the average American slows, and even begins to decline, I expect increasing deflationary pressure in the more middle-to-lower class discretionary segments of the economy as demand slows. This deflationary pressure may be offset for a time by increasingly aggressive monetary policy, but I believe more expansionary monetary policies likely raises food and oil price. Ultimately, our monetary-policy-fueled economy becomes a snake eating its tail, in my view.
The two points I take away from the EPI data are:
(1) Increasingly volatile prices due to aggressive monetary policies. Prices for everyday products have become progressively more volatile over the past couple decades as the activist monetary policies have attempted to offset the fundamental deflationary forces in the economy, in my view. Recently, the EPI swung from a 15% increase to a 10% decline between 2008 and 2010. This increased volatility makes budgeting more difficult for the average American. Assuming monetary policies continue their aggressive policies, I expect the EPI to become even more volatile.
 Source: AIER
(2) Moderating real income growth for the average American. For this analysis I took the Personal Income (actual) data provided by the government and adjusted it to 2011 prices based on EPI data. This measure of real income should provide a good reflection of the trends impacting middle and lower class citizens, for which non-discretionary items like food and fuel account for a larger percentage of consumption.
This measure highlights, in my view, the increasing pressure on the average American as their real income growth slows, and even turns negative. It also reinforces many of the frustrations expressed by grass roots movements like the Tea Party and Occupy. So far the moderating real income growth has been partially offset by falling prices for things like consumer electronics and by competition within a overly-saturated retailing segment. Furthermore, the falling interest rates have enabled the average American take on more debt to fund on-going consumption.

The EPI is calculated by the American Institute of Economic Research to address a concern that the CPI does not fairly reflect the price fluctuations impacting day-to-day consumers. The EPI tracks common household items purchased frequently, such as food, fuel and toothpaste.
To start, any measure of inflation has its flaws, so one must tread lightly when highlighting these measurements. For example, the EPI is biased towards more inelastic prices, or products less impacted by economic cycles, because it focuses more on non-discretionary items. Secondly, the EPI is weighted heavily to food and beverages (38-47% of the EPI), and motor fuel and transportation (14-20%). Thus the index is much more sensitive to changes in the relatively volatile commodity prices. It also minimizes the effect of many sectors experiencing deflationary forces, such as technology and manufacturing. All that said, it does offer some insight into interesting trends.
The EPI highlights a couple trends I have been arguing under my Sagflation theme of slow to negative real economic activity combined with more volatile prices caused by aggressive monetary policies. As the "real" income of the average American slows, and even begins to decline, I expect increasing deflationary pressure in the more middle-to-lower class discretionary segments of the economy as demand slows. This deflationary pressure may be offset for a time by increasingly aggressive monetary policy, but I believe more expansionary monetary policies likely raises food and oil price. Ultimately, our monetary-policy-fueled economy becomes a snake eating its tail, in my view.
The two points I take away from the EPI data are:
(1) Increasingly volatile prices due to aggressive monetary policies. Prices for everyday products have become progressively more volatile over the past couple decades as the activist monetary policies have attempted to offset the fundamental deflationary forces in the economy, in my view. Recently, the EPI swung from a 15% increase to a 10% decline between 2008 and 2010. This increased volatility makes budgeting more difficult for the average American. Assuming monetary policies continue their aggressive policies, I expect the EPI to become even more volatile.

(2) Moderating real income growth for the average American. For this analysis I took the Personal Income (actual) data provided by the government and adjusted it to 2011 prices based on EPI data. This measure of real income should provide a good reflection of the trends impacting middle and lower class citizens, for which non-discretionary items like food and fuel account for a larger percentage of consumption.
This measure highlights, in my view, the increasing pressure on the average American as their real income growth slows, and even turns negative. It also reinforces many of the frustrations expressed by grass roots movements like the Tea Party and Occupy. So far the moderating real income growth has been partially offset by falling prices for things like consumer electronics and by competition within a overly-saturated retailing segment. Furthermore, the falling interest rates have enabled the average American take on more debt to fund on-going consumption.

Wednesday, March 7, 2012
Consumer Credit Rises, Financial Strain Builds
Consumer borrowing increased 8.6% annually during the month of January, lifting total consumer borrowing to $2.536 trillion, within about $50 billion of the highest level in US history of $2.587 trillion in July 2008. There is some debate as to whether increasing consumer borrowing is a stimulant for the economy or an indicator of financial stress. After going through the numbers I believe the answer is quite clearly an indicator of financial stress.
The only major holders of debt to increase more than 2% annually were the federal government and savings institutions. Borrowing from the federal government increased 32% to $453 billion. The next biggest percentage increase came from the relatively small category of savings institutions with 5.6% to $55.4 billion. Student loan debt is captured in the federal government category. Both commercial banks and finance banks reported a sequential decline in borrowing and relatively flat annual growth. I believe these statistics illustrate that the average US consumer is under more financial strain, unable or less willing to pay for their children's schooling, and lending institutions remain wary of extending further credit.
The only major holders of debt to increase more than 2% annually were the federal government and savings institutions. Borrowing from the federal government increased 32% to $453 billion. The next biggest percentage increase came from the relatively small category of savings institutions with 5.6% to $55.4 billion. Student loan debt is captured in the federal government category. Both commercial banks and finance banks reported a sequential decline in borrowing and relatively flat annual growth. I believe these statistics illustrate that the average US consumer is under more financial strain, unable or less willing to pay for their children's schooling, and lending institutions remain wary of extending further credit.
Tuesday, March 6, 2012
Bought Gold
Just before the close I established a small ~1% position in gold through the ETF IAU. Over the next few weeks I plan to evaluate the position and potentially increase the size. I have become more bullish on gold and have waded back into it for the following reasons:
(1) The significant pull back in the price of gold during the month.
(2) Potentially increasing risk associated with the middle east, Europe and the US economy, resulting in investors looking for the perceived safety of the precious metal.
(3) Potentially escalating aggressiveness in US monetary policy reactions should the economy appear threatened.
I remain concerned that gold may continue to slide should the US dollar strengthen due to weakness in foreign economies.
Friday, March 2, 2012
2012: Year of Crisis
The shipping industry is expecting a "year of crisis" as the supply of ships is expected to increase dramatically again, during a time of excess supply already. To me, this represents another proof point that capital is not being allocated efficiently in the economy due to inexpensive financing and aggressive monetary policies. While the monetary policies may boost the prices of financial assets and commodities for a period, at some point the building inefficiencies likely overwhelm the ability of the central banks. Either that, or we start printing money and flirting with hyper-inflation. In short, Sagflation - volatile prices combined slow-to-negative real economic growth.
Thursday, March 1, 2012
Listen to the Market. Are Treasuries Anticipating Deflation?
Always be skeptical of someone who tells you the market is wrong. I believe the market can be very inefficient, offering attractive opportunities, but you must be careful. I especially turn a skeptical eye when the "crowd" argues the market is wrong.
Take for example the current argument that the price of treasuries is wildly inflated, pushing yields well below their "natural" price. To start, in a period of activist monetary policy this could very well be true and in one-to-two years we could all be paying through the nose to borrow. After all, the central banks can clearly create inflation if they are determined enough. But, let me humbly make the assumption that the yield on treasuries is trying to tell us that we are in a fundamental deflationary environment.
The point of this article is that I believe monetary policies have been the primary driver of higher commodity prices. The rise in commodity prices has been pushing up inflation from the bottom of the supply chain, offsetting deflationary pressures from excessive supply in segments like retail, housing and shipping. Monetary policies have lowered financing costs, allowing demand to remain somewhat healthy, albeit at the expense of rising consumer debt levels. I'll make my point in a series of questions: Since we are in a period of expansionary monetary policies producing modest inflation, what happens to prices when monetary policies move to neutral? Or, monetary policies lose their effectiveness? Is the treasury market simply anticipating a deflationary environment, or even recognizing the fundamental deflationary forces already at work in the economy?
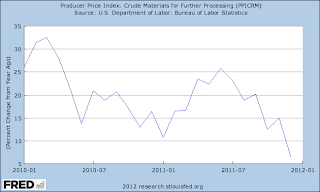
To look at this issue, I have chosen to look at the various inflation measurements. The PPI for crude materials is an inflation measure that includes unprocessed commodities not sold directly to consumers. Examples include crude petroleum, natural gas, coal, raw cotton, construction sand and gravel. The PPI for intermediate goods consists partly of commodities that have been processed that still require further processing, as well as non-durable, physically complete goods purchased by business firms as inputs for their operations. Examples include flour, cotton yarn, lumber, diesel fuel, belts and belting. The PPI for finished goods includes commodities that are ready for sale to the final-demand user, either an individual consumer or a business firm. Finally, I relate the various PPI measures of inflation to both the CPI and Personal Consumption Expenditures Price Index (PCEPI).
The PPI for crude materials increased at an annual rate of almost 20% during 2010 and 2011.
The PPI for intermediate goods increased at an annual rate of of around 8% during 2010 and 2011.

The PPI for finished goods increased an average of 5% during 2010 and 2011.

The CPI increased an average of 2.5% during 2010 and 2011.

The PCEPI, the preferred measure of inflation used by the Federal Reserve, increased an average of about 2% during 2010 through 2011.

A couple points to take away:
(1) The largest price increases occur early in the supply chain, impacted by commodity prices. As goods move through the supply chain, and a greater percentage of cost becomes labor and other expenses, the overall price increases diminish. I believe this highlights an ability to offset higher commodity prices with deflationary forces of labor rationalization and technology investments. I believe it also highlights an inability to pass along higher costs due to excessive supply later in the supply chain.
(2) All five of these indices peak around the middle of 2011. The PPI measuring crude materials peaked in June at 25.8% annual increase, followed by the PPI for both intermediate and finished goods in July at 11.8% and 7.2% respectively, the CPI in September at 3.9%, and the PCEPI at just under 3% in September. I believe these sequential peaks further illustrate the fundamental driver of inflation, which is commodities as they move through the supply chain.
(3) The price increases for PPI crude materials has slowed dramatically in 2012, likely causing the slowing price increases in all the other price indices. The slowing commodity price increases are likely due to multiple factors, such as more supply coming on-line, moderating demand as management teams substitute inputs and change products to offset price increases, and modest economic growth.
My conclusion is that aggressive monetary policy has been driving inflation from the bottom of the supply chain through commodity prices. Companies have been offsetting these cost increases through cost-cutting activities to improve efficiencies. Companies are able to improve efficiencies because there is slack in the labor force, both from a high unemployment rate and access to cheap foreign labor, and due to relatively inexpensive cost of capital, in the form of low interest rates. Additionally, commodity price increases are moderating, which may ultimately help economic growth. If the primary driver of inflation is moderating, and there remains excess supply in the economy, there is increasing potential for deflation unless central banks take expansionary policies up another notch.
Take for example the current argument that the price of treasuries is wildly inflated, pushing yields well below their "natural" price. To start, in a period of activist monetary policy this could very well be true and in one-to-two years we could all be paying through the nose to borrow. After all, the central banks can clearly create inflation if they are determined enough. But, let me humbly make the assumption that the yield on treasuries is trying to tell us that we are in a fundamental deflationary environment.
The point of this article is that I believe monetary policies have been the primary driver of higher commodity prices. The rise in commodity prices has been pushing up inflation from the bottom of the supply chain, offsetting deflationary pressures from excessive supply in segments like retail, housing and shipping. Monetary policies have lowered financing costs, allowing demand to remain somewhat healthy, albeit at the expense of rising consumer debt levels. I'll make my point in a series of questions: Since we are in a period of expansionary monetary policies producing modest inflation, what happens to prices when monetary policies move to neutral? Or, monetary policies lose their effectiveness? Is the treasury market simply anticipating a deflationary environment, or even recognizing the fundamental deflationary forces already at work in the economy?
To look at this issue, I have chosen to look at the various inflation measurements. The PPI for crude materials is an inflation measure that includes unprocessed commodities not sold directly to consumers. Examples include crude petroleum, natural gas, coal, raw cotton, construction sand and gravel. The PPI for intermediate goods consists partly of commodities that have been processed that still require further processing, as well as non-durable, physically complete goods purchased by business firms as inputs for their operations. Examples include flour, cotton yarn, lumber, diesel fuel, belts and belting. The PPI for finished goods includes commodities that are ready for sale to the final-demand user, either an individual consumer or a business firm. Finally, I relate the various PPI measures of inflation to both the CPI and Personal Consumption Expenditures Price Index (PCEPI).
The PPI for crude materials increased at an annual rate of almost 20% during 2010 and 2011.

The PPI for intermediate goods increased at an annual rate of of around 8% during 2010 and 2011.

The PPI for finished goods increased an average of 5% during 2010 and 2011.

The CPI increased an average of 2.5% during 2010 and 2011.

The PCEPI, the preferred measure of inflation used by the Federal Reserve, increased an average of about 2% during 2010 through 2011.

A couple points to take away:
(1) The largest price increases occur early in the supply chain, impacted by commodity prices. As goods move through the supply chain, and a greater percentage of cost becomes labor and other expenses, the overall price increases diminish. I believe this highlights an ability to offset higher commodity prices with deflationary forces of labor rationalization and technology investments. I believe it also highlights an inability to pass along higher costs due to excessive supply later in the supply chain.
(2) All five of these indices peak around the middle of 2011. The PPI measuring crude materials peaked in June at 25.8% annual increase, followed by the PPI for both intermediate and finished goods in July at 11.8% and 7.2% respectively, the CPI in September at 3.9%, and the PCEPI at just under 3% in September. I believe these sequential peaks further illustrate the fundamental driver of inflation, which is commodities as they move through the supply chain.
(3) The price increases for PPI crude materials has slowed dramatically in 2012, likely causing the slowing price increases in all the other price indices. The slowing commodity price increases are likely due to multiple factors, such as more supply coming on-line, moderating demand as management teams substitute inputs and change products to offset price increases, and modest economic growth.
My conclusion is that aggressive monetary policy has been driving inflation from the bottom of the supply chain through commodity prices. Companies have been offsetting these cost increases through cost-cutting activities to improve efficiencies. Companies are able to improve efficiencies because there is slack in the labor force, both from a high unemployment rate and access to cheap foreign labor, and due to relatively inexpensive cost of capital, in the form of low interest rates. Additionally, commodity price increases are moderating, which may ultimately help economic growth. If the primary driver of inflation is moderating, and there remains excess supply in the economy, there is increasing potential for deflation unless central banks take expansionary policies up another notch.
February Performance
As one would expect given my more balanced portfolio at the start of the month between long and short equity positions, as well as a significant position in high yield bonds, my performance was relatively flat during the month of February. Specifically, the balance decreased 40 basis points during the month, clearly underperforming the best January/February performance by the S&P 500 since 1991. The loss was largely attributable to my position in the ETF BOIL, which attempts to track the price of natural gas. While the price of natural gas at the end of the month was close to the price at which I had purchased the ETF, the actual price of the ETF had declined over 10%. For this reason of inefficient tracking I sold the ETF earlier this week.
My exposure at the end of the month is summarized as follows:
29% Cash
37% High Yield Bonds
22% Equity Short
8% Equity Long
4% Commodities (Agricultural)
The exposure highlights my more bearish view on the markets, with the large cash position and significant short position. The equity long positions are in more defensive industries like consumer non-discretionary and healthcare. The position in commodities is also focused on consumer staples in the form of food. The large exposure to high yield bonds is theme driven, such as rising auto sales. The bonds should continue to perform well if the economy continues to improve, unless interest rates spike. Alternatively, the bonds should perform well if treasury yields remain low or continue to decline, unless the economy falls completely through the floor. At the very least, if I'm going to have some "long" exposure to the economy, I prefer to be higher in the capital structure. My biggest worry is that monetary policies continue to drive equity markets higher.
Subscribe to:
Posts (Atom)